Our ‘new normal’ keeps changing and finance teams must adjust processes including people, process, culture, and technology to adapt.
Confronting a historic level of uncertainty has rendered traditional methods of data analytics, forecasting, and scenario planning all but useless.
Predictions for the return to business-as-usual, as far as scope and scale, remain wide-ranging. The old approach to the finance function is coming up short in an unprecedented crisis, but there is a path forward.
Better yet, you can learn how to adjust to thrive and not just survive in the ‘new normal.’ But how?
This article addresses exactly what this ‘new normal’ looks like for finance teams, particularly regarding financial data analytics, forecasting, and scenario planning.
Topics covered in this article:
- What the new normal looks like for FP&A
- Where your organization is on the FP&A maturity curve
- Common pain points in financial data analytics
- 4 tips to build a culture of analytics
- Expected user experience & common data challenges
- Traditional data analysis approach vs modern data approach
- The game changer: direct data mapping
- Financial data analytics maturity model
- The new normal: Forecasting
- The new normal: Scenario planning
The new normal for FP&A: A roadmap
The key to great forecasting and outstanding scenario planning is good data analytics. You need to think about how you represent your data because representation matters.
Avoid overcomplicating it and remember Occam’s Razor and the Law of Parsimony, which states that "entities should not be multiplied beyond necessity."
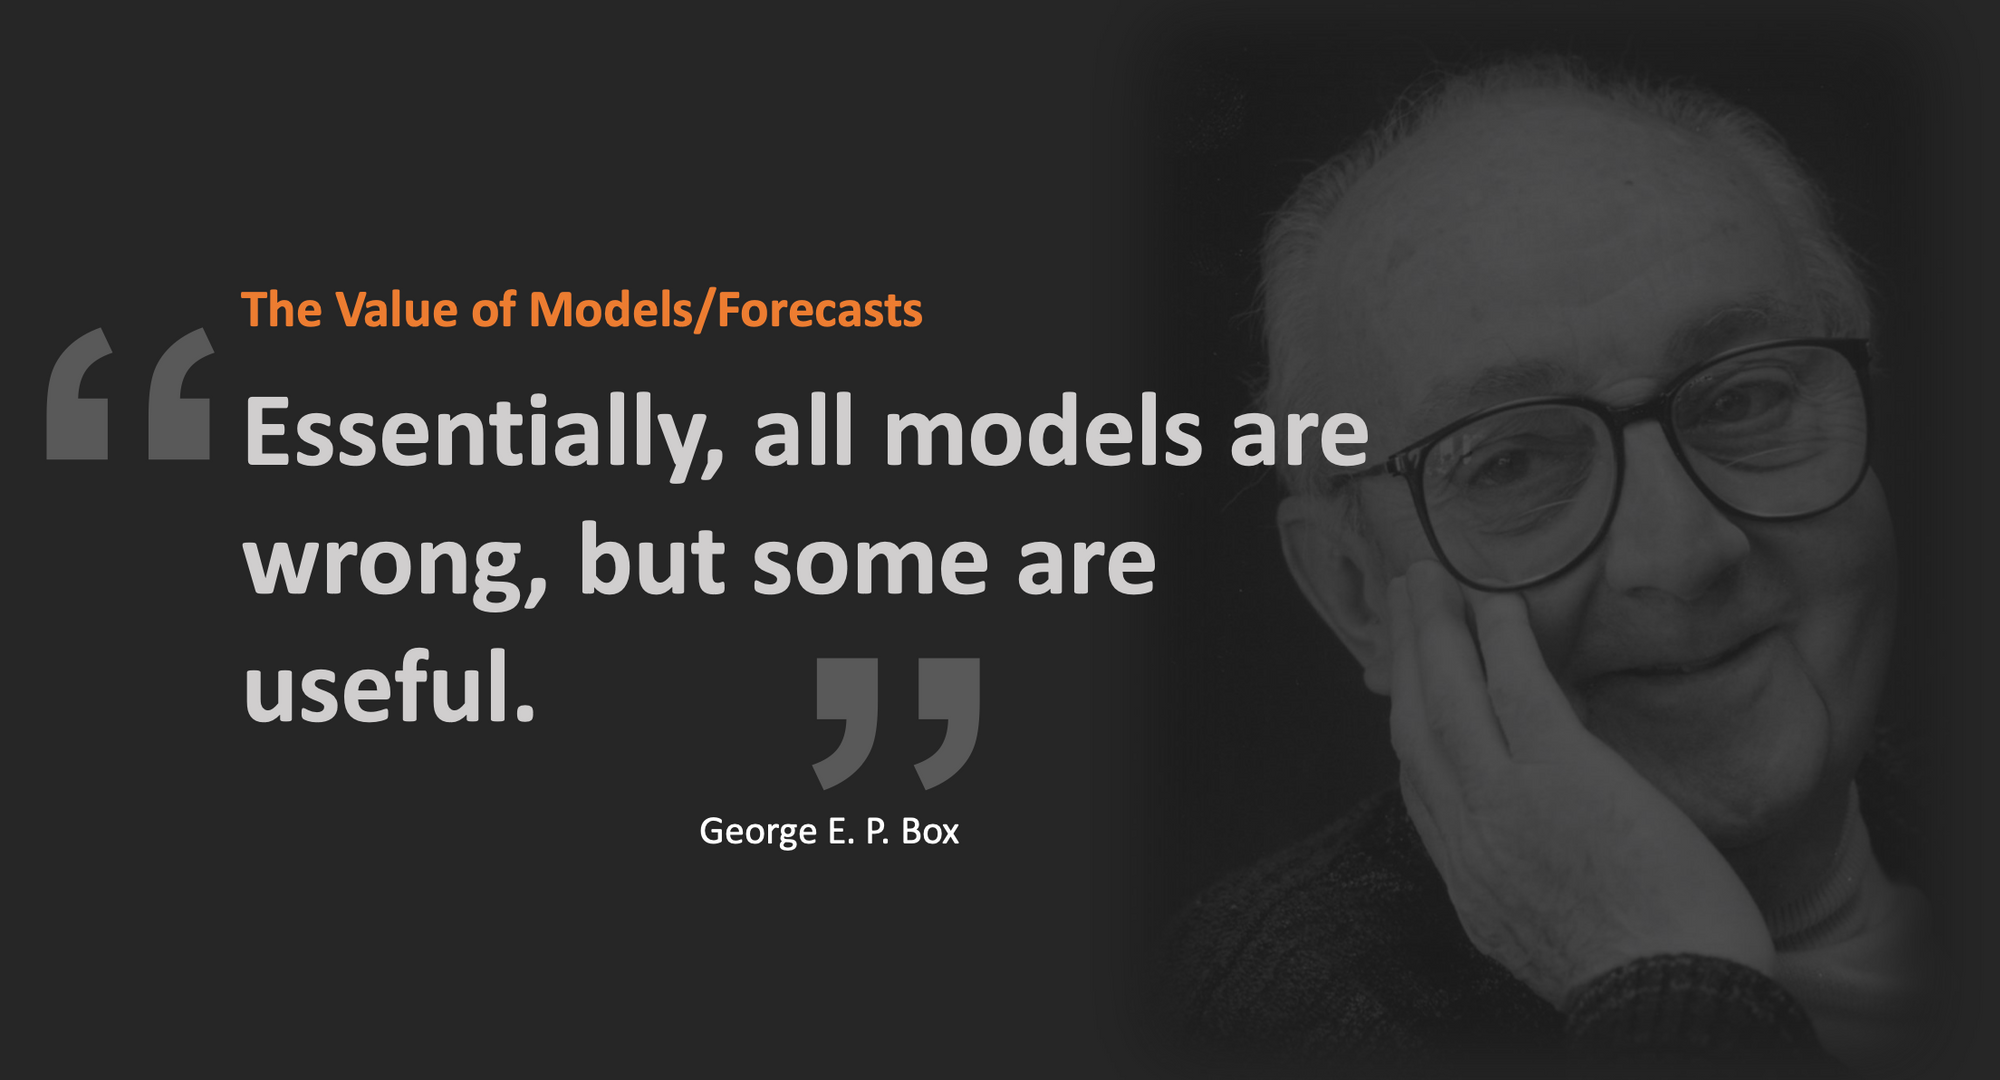
In other words, if you’re given two solutions to a problem, the simpler one is usually correct. This theory was echoed by both George Box and Albert Einstein:
“All models are wrong, but some are useful.” – George Box
“Everything should be made as simple as possible, but no simpler.” – Albert Einstein
Where is your organization on the FP&A maturity curve?
The American Productivity and Quality Centre came out with a very interesting benchmark assessment called the Planning and Management Accounting Open Standards Benchmarking Assessment, which lets you know where you are on the FP&A maturity curve (see slide below).
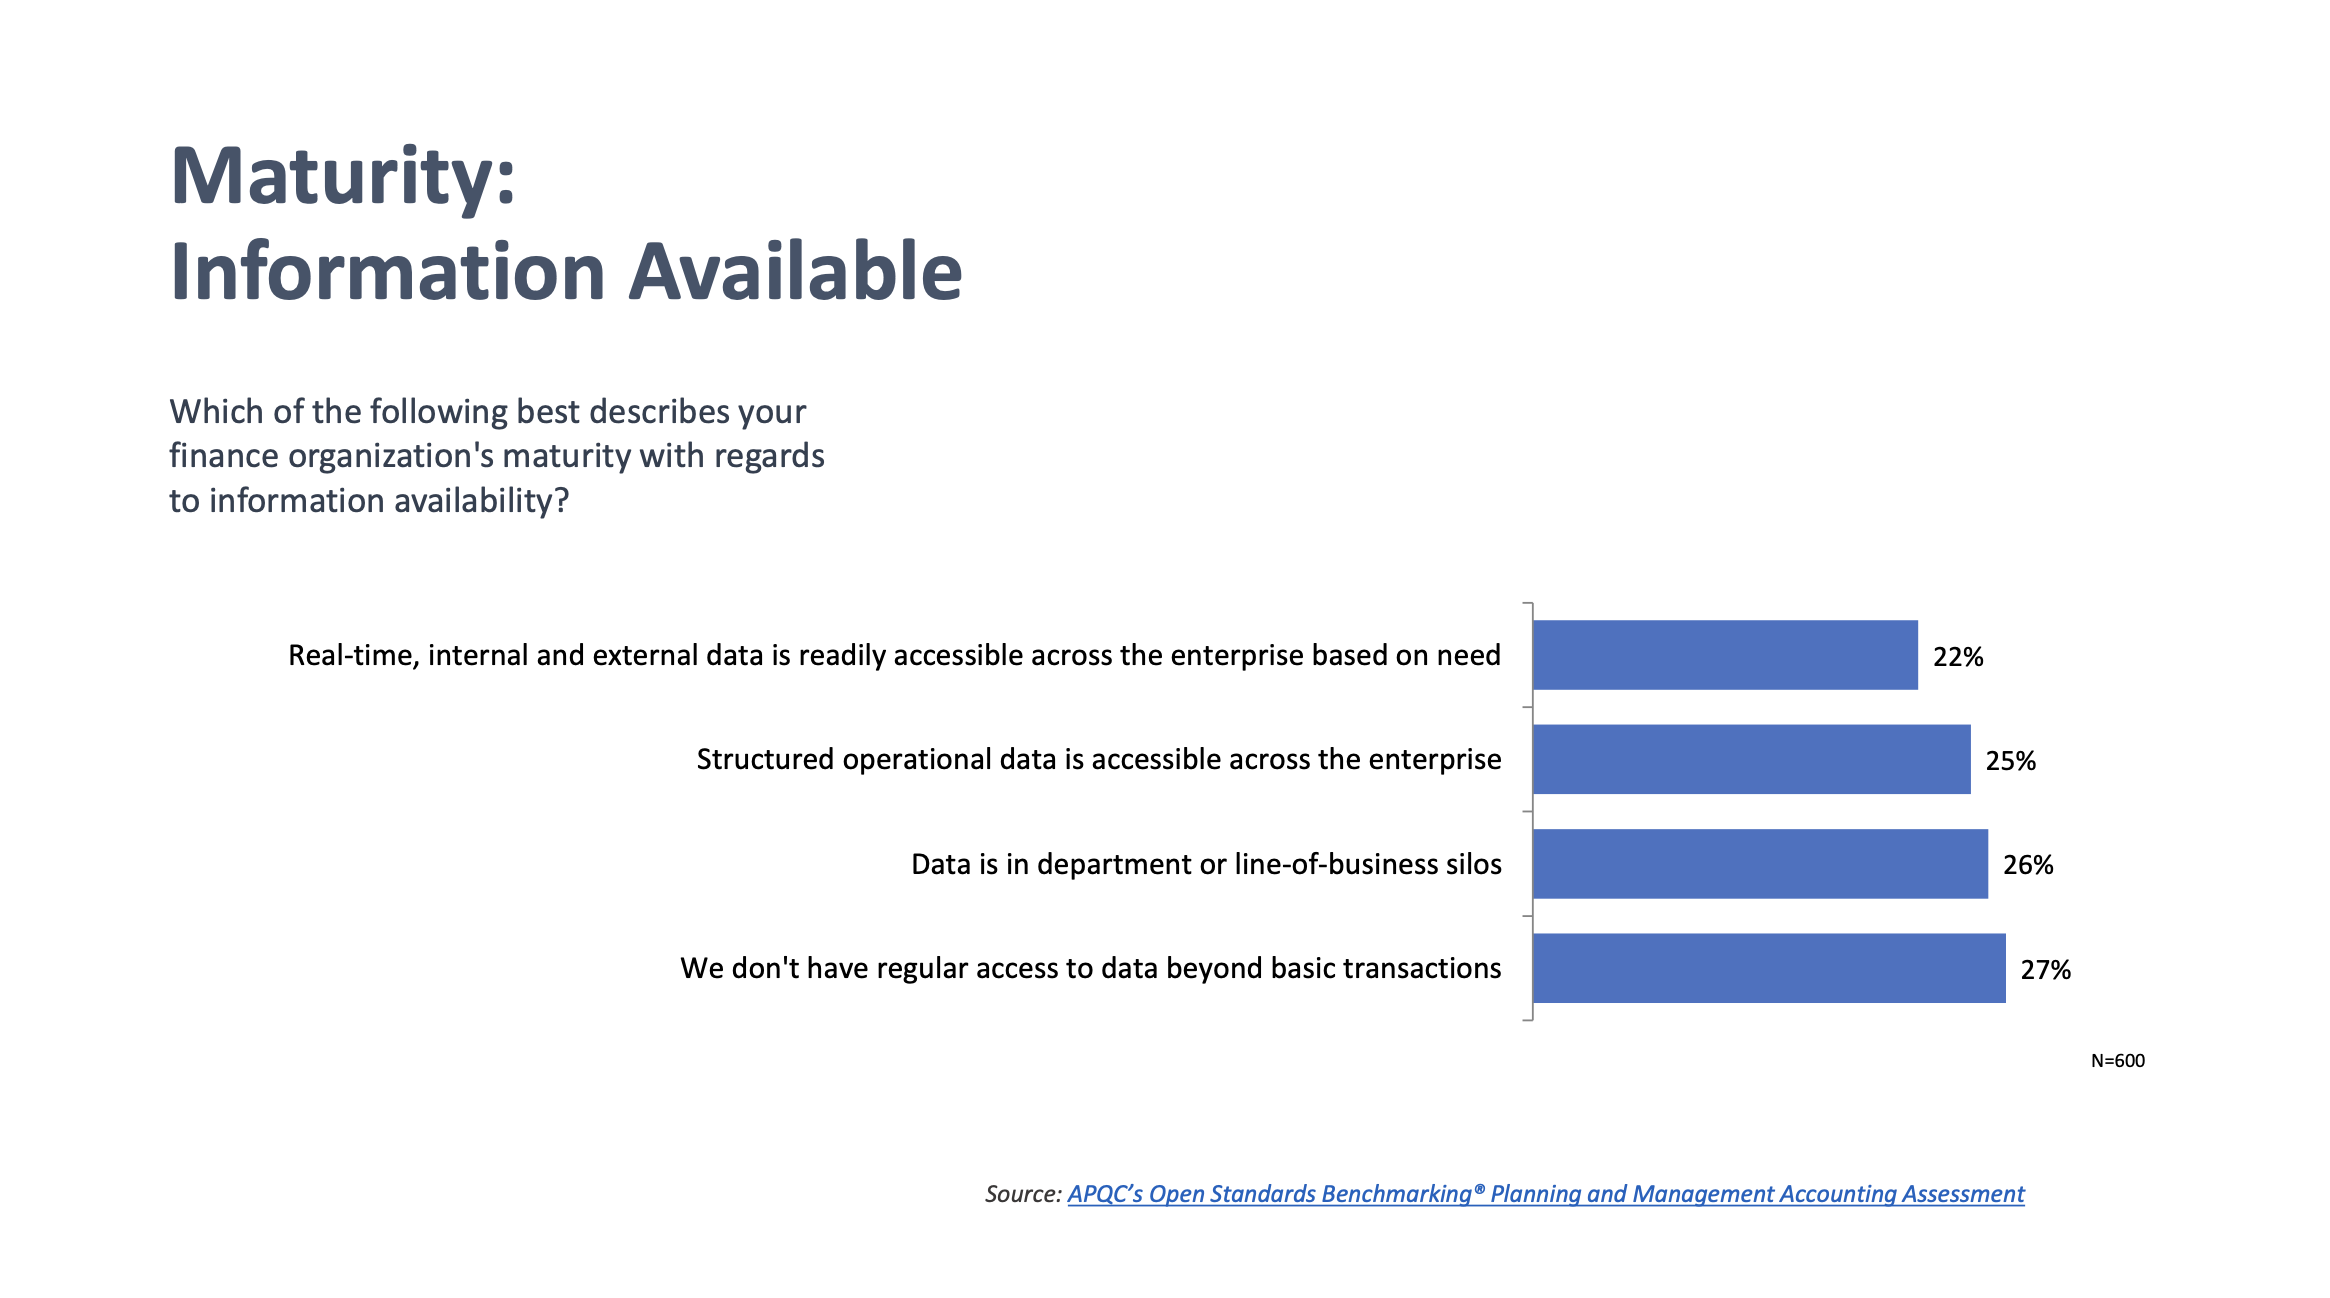
When it comes to information availability, 22% of survey respondents reported that real-time, internal and external data is readily accessible across the enterprise based on need.
Data-driven planning is a similar story:
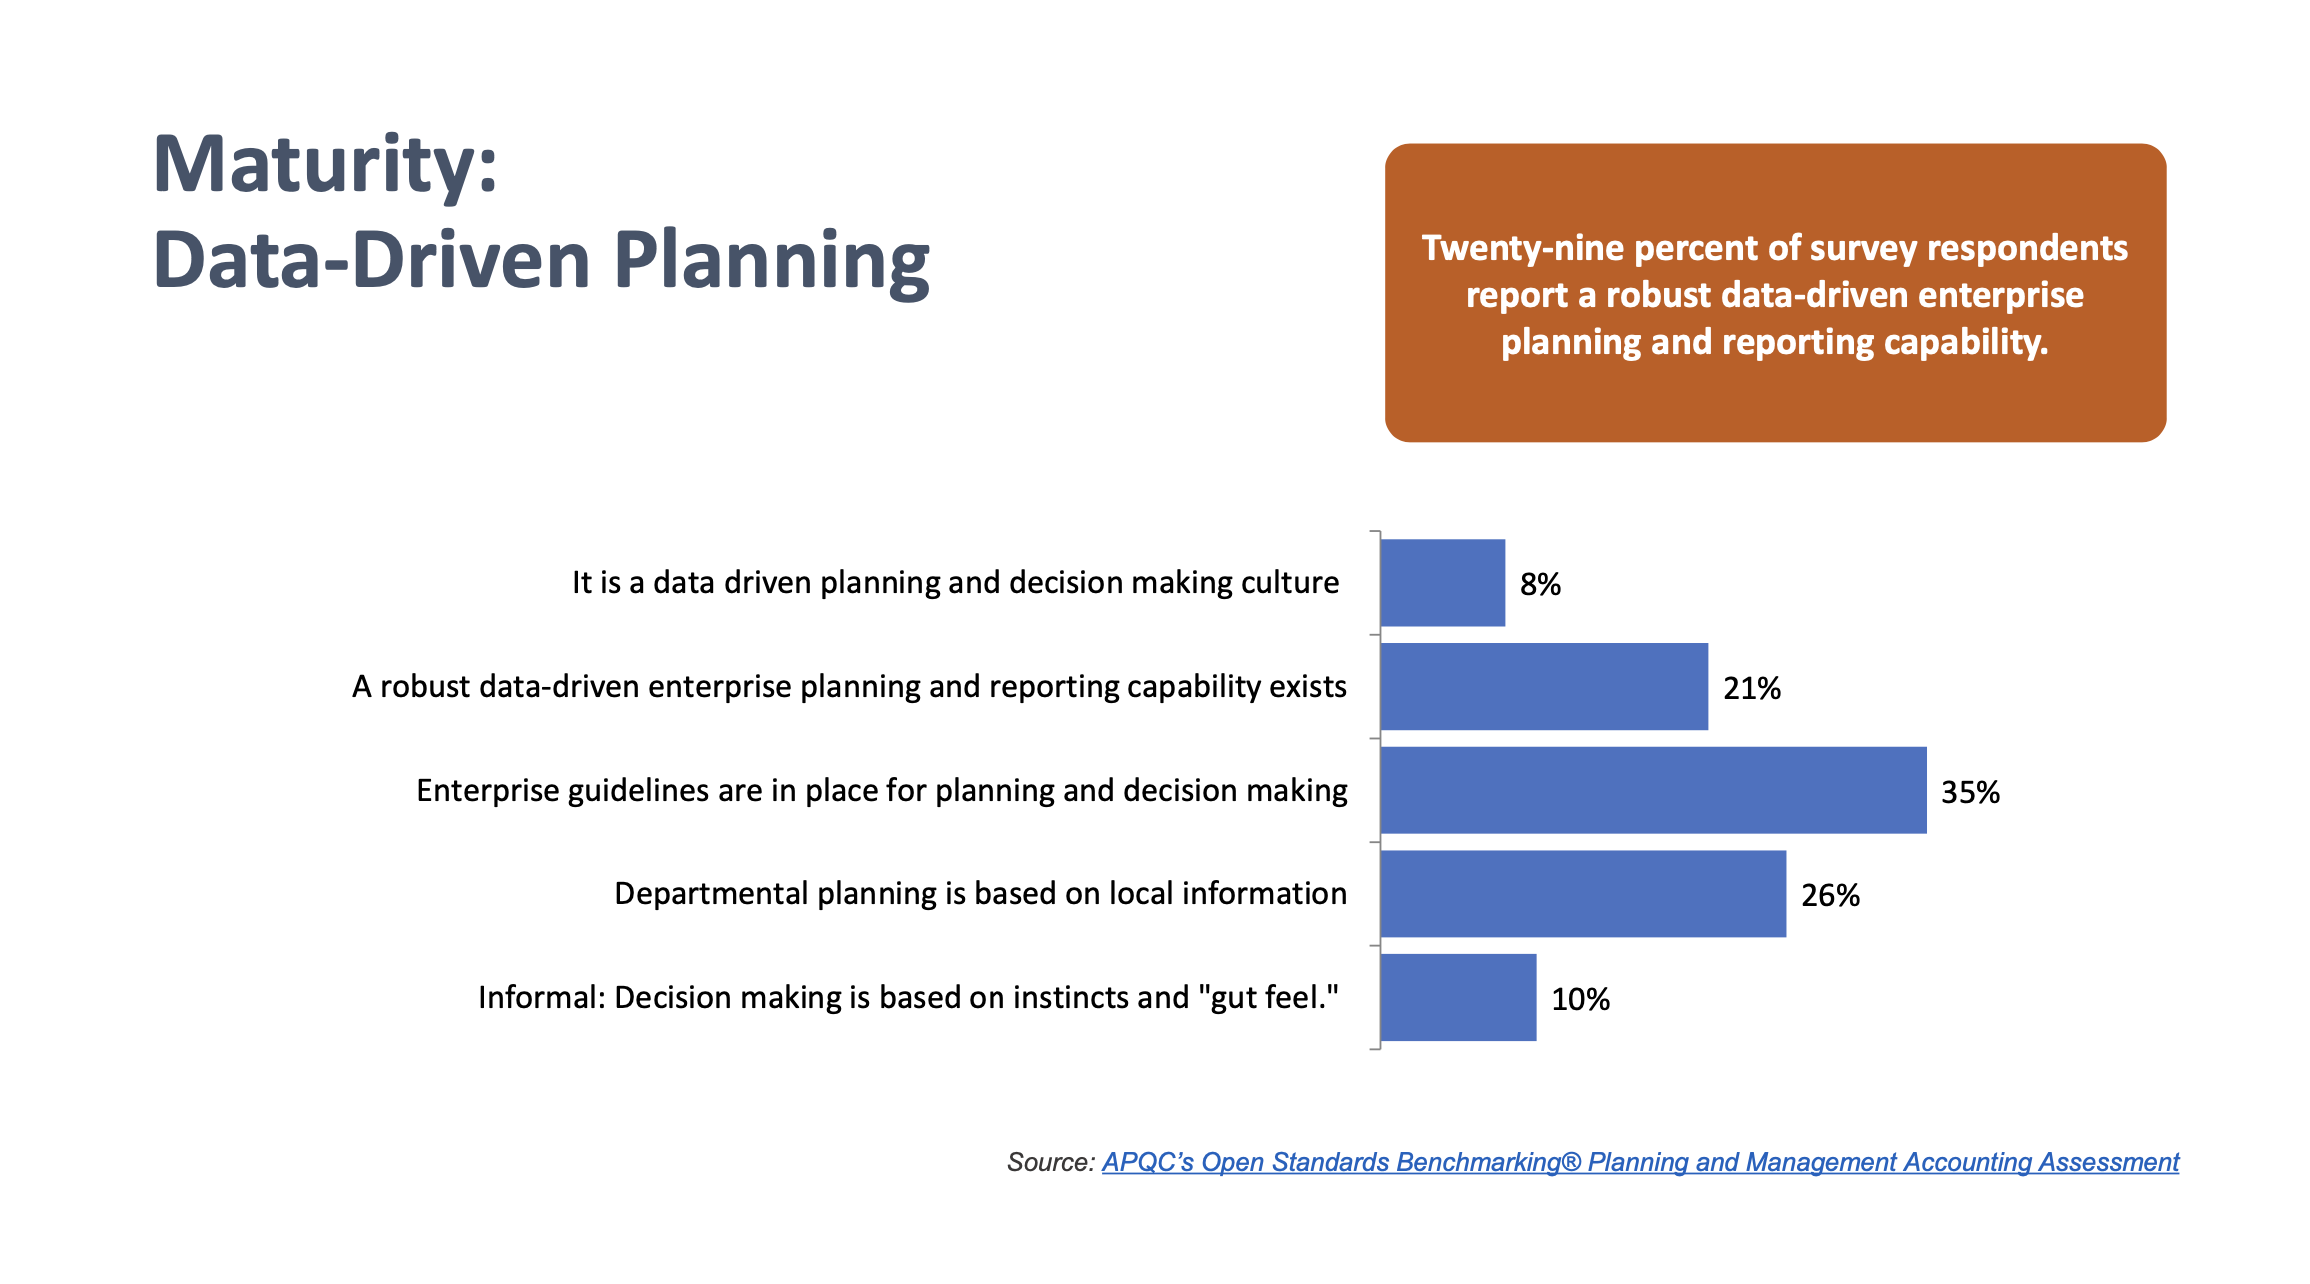
Around 29% of survey respondents report a robust data-driven enterprise planning and reporting capability. In doing so, organizations take a giant leap toward creating a culture of analytics for data-driven decision-making.
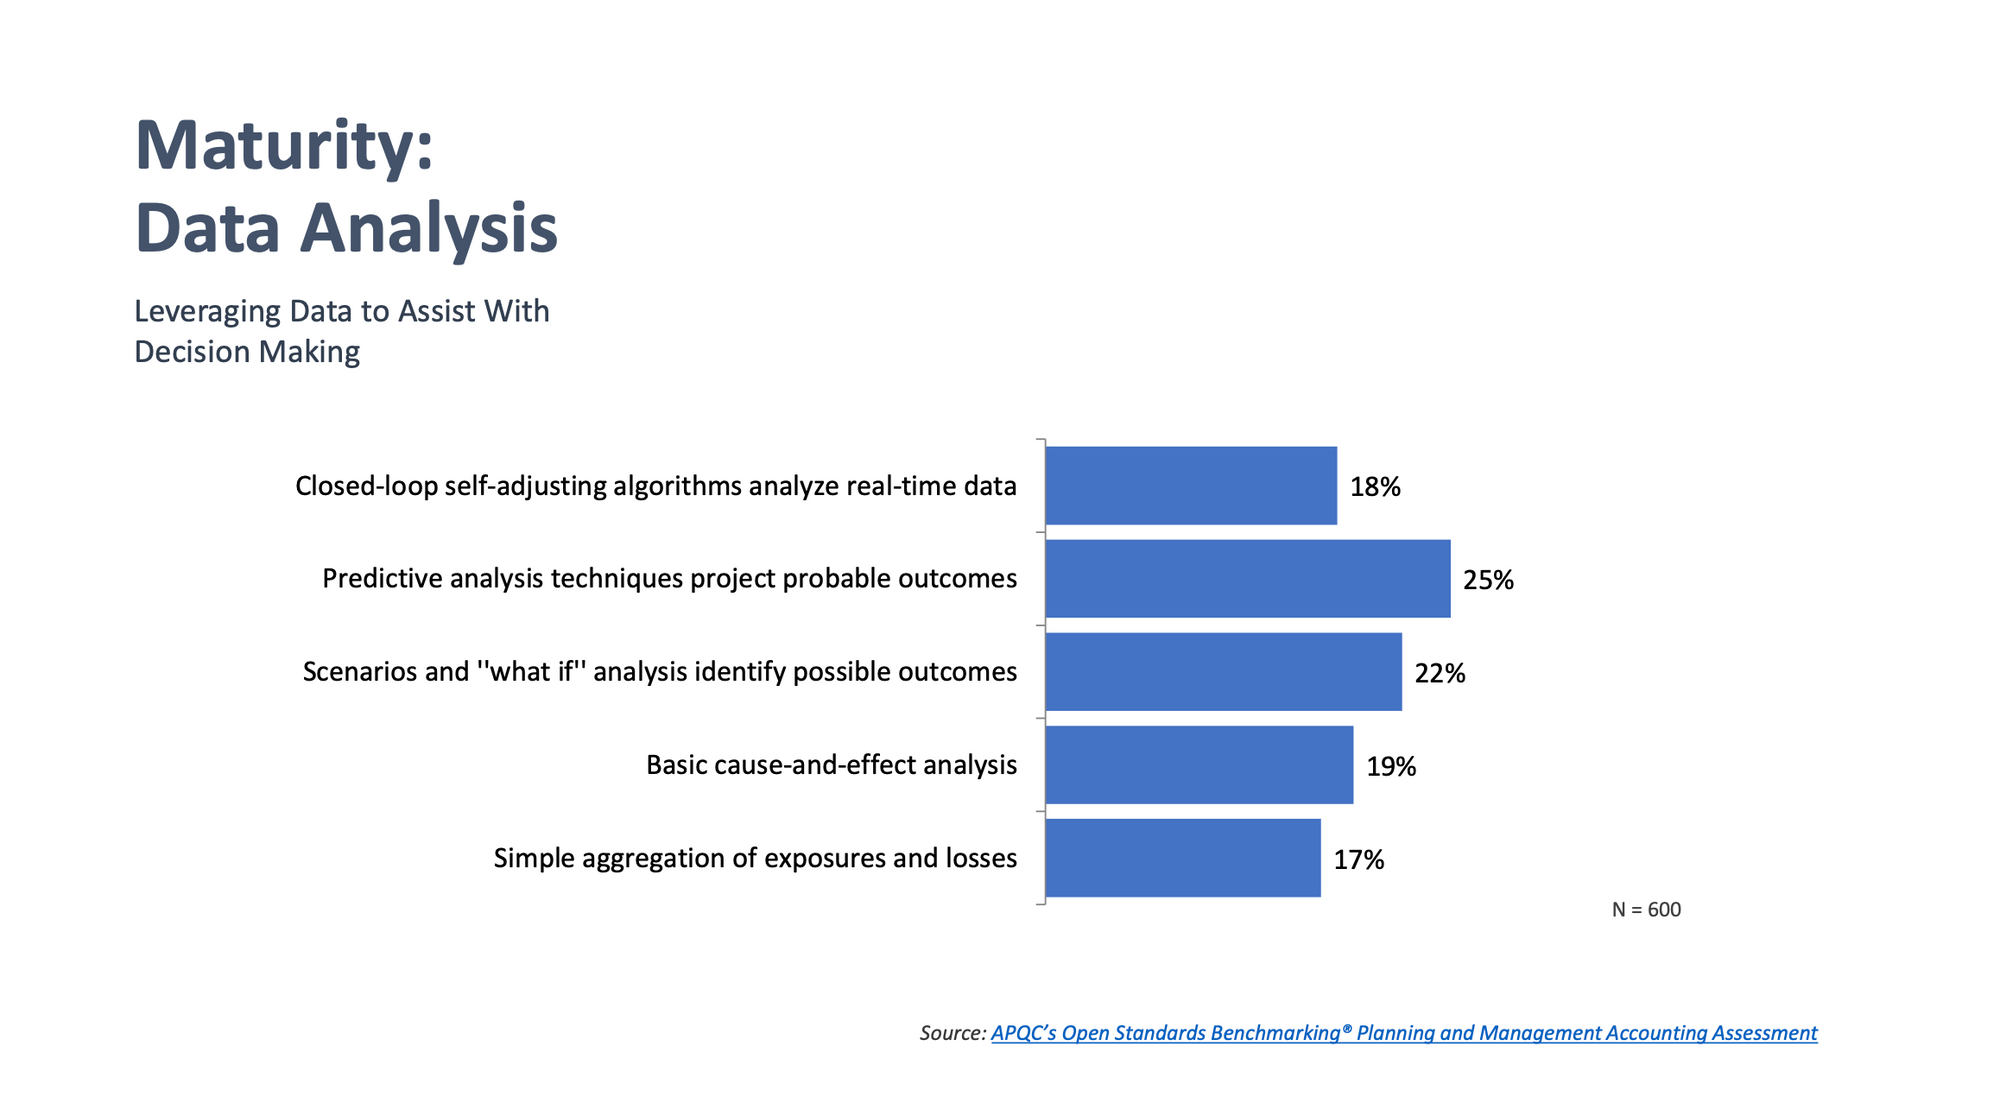
When asked questions about how they leverage data to assist with decision-making, only 18% reported using closed-loop self-adjusting algorithms to analyze real-time data:
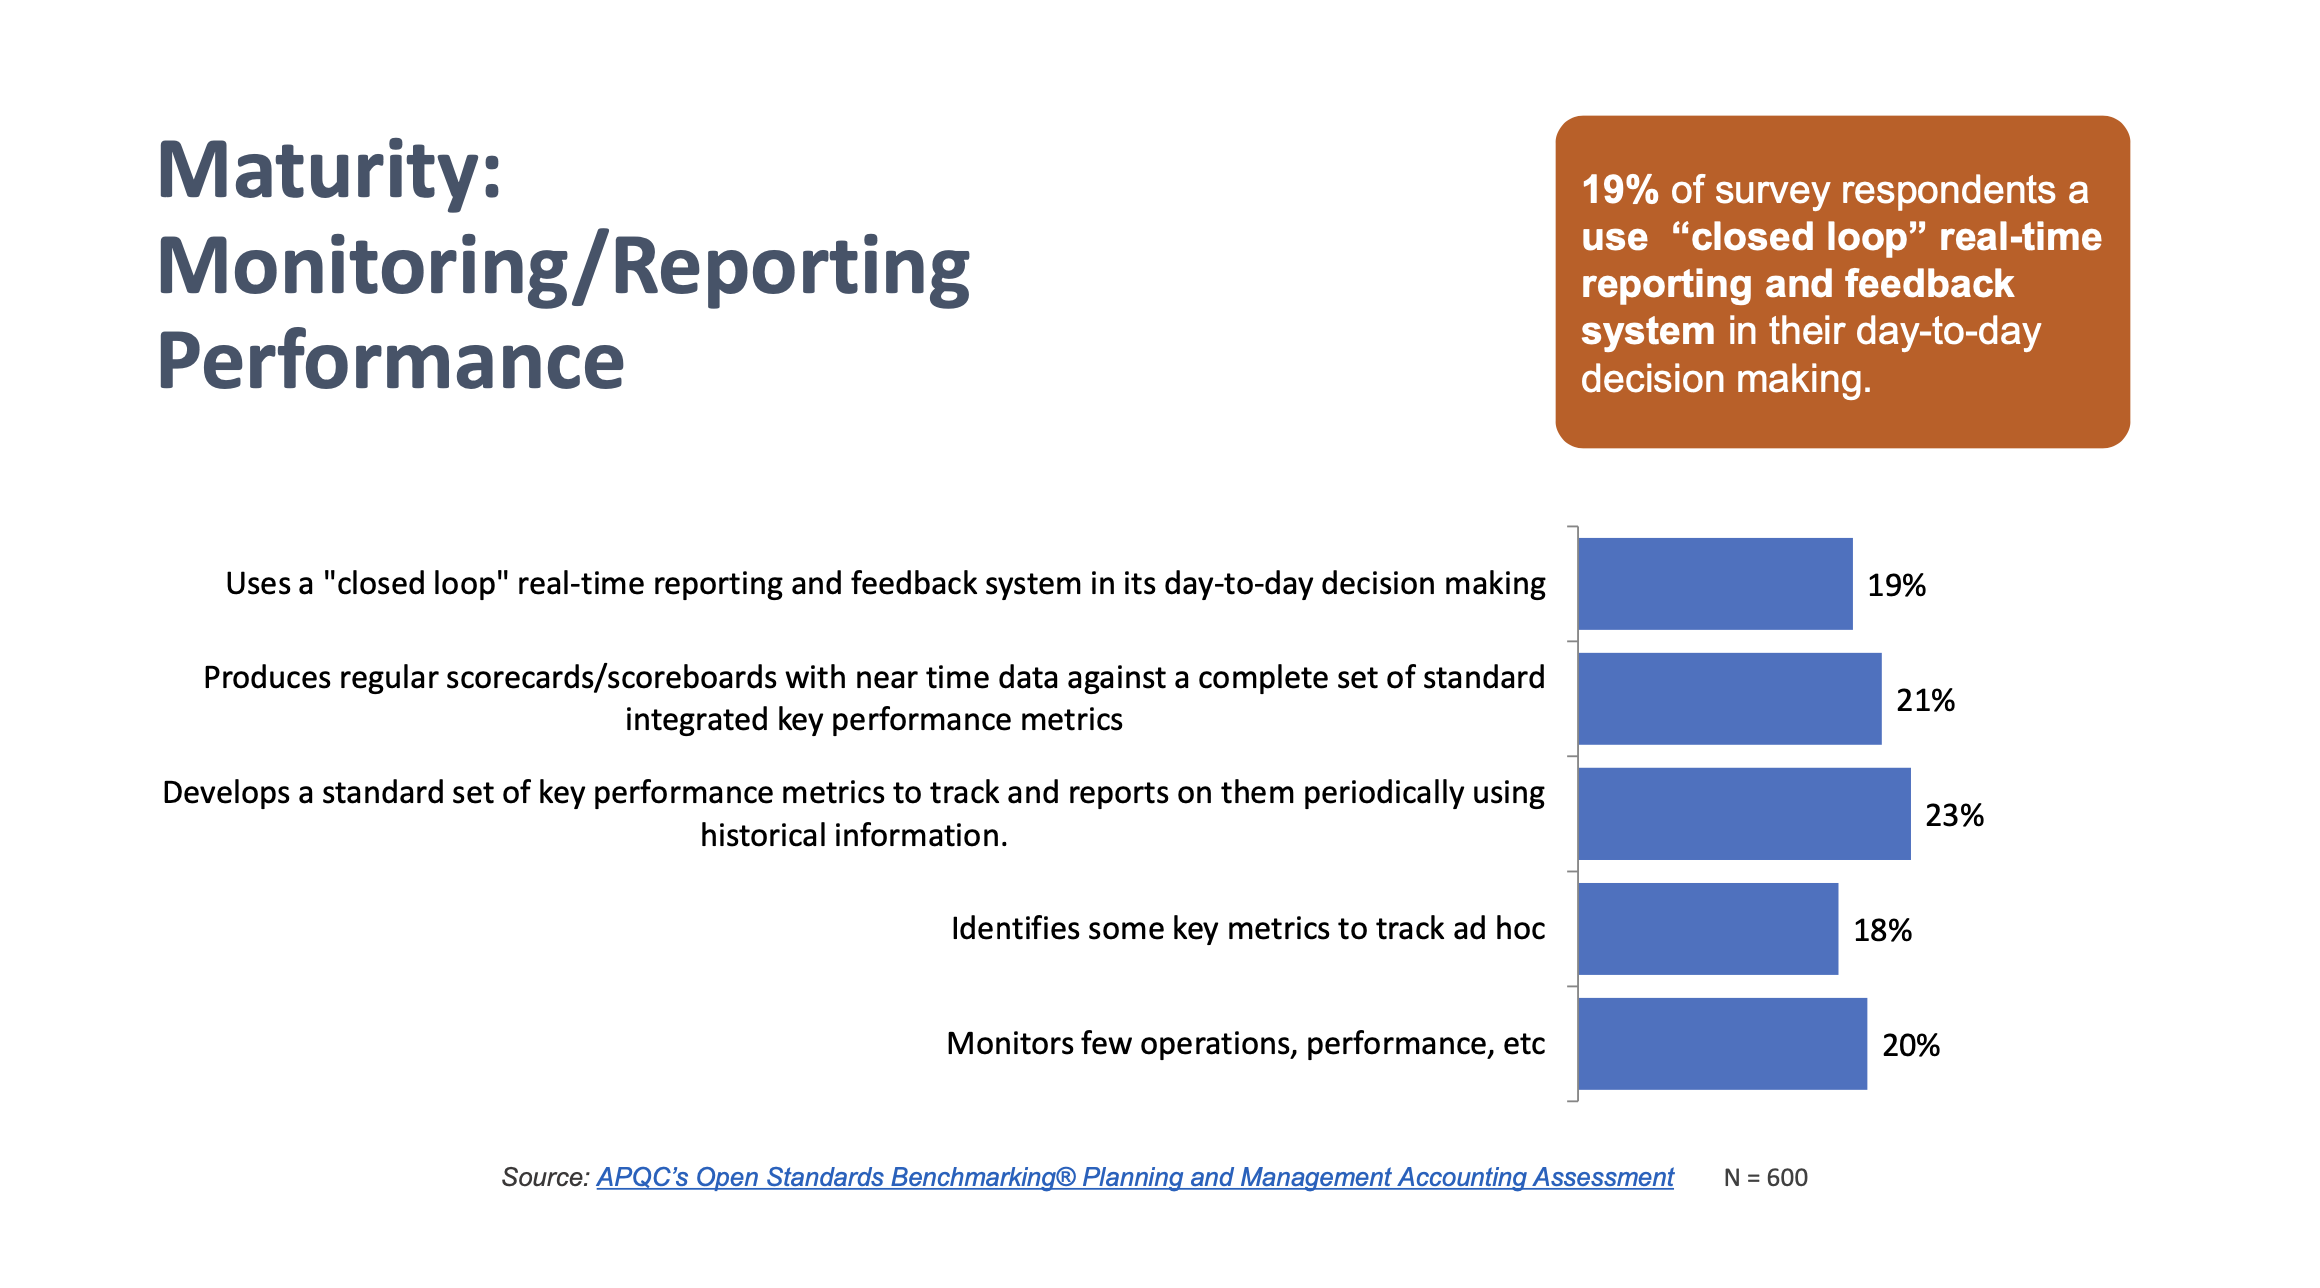
Concerning the maturity of monitoring and reporting operational performance, a decent number are producing regular scorecards/scoreboards with near-time data.
However, only 19% of survey respondents use ‘closed loop’ real-time reporting and feedback systems in their day-to-day decision-making.
So, what can we take away from these findings?
Hopefully, by looking at this data, you can see that you’re not alone. Everyone's at a different point on the curve, and there's always room to grow.
Common pain points in financial data analytics
There are a few common pain points in data analytics that many organizations and finance functions struggle with. Take a look at them below and think about which of these pain points you believe is most prevalent within your organization:
- Hard to access data from legacy systems.
- Too many disconnected data sources.
- Data accuracy concerns.
- Limited real-time analytics/visualization.
- Limited self-service reporting across the enterprise.
Something that often gets left to the side lines when organizations want to do more with data analytics in finance is the importance of empowering your employees – including the FP&A team and your business partners.

4 tips to build a culture of financial data analytics
Here are four tips to empower your employees so they can also help build a culture of analytics to develop and act on business insights:
1. Deliver consistent reporting and dashboards
Increased speed, consistency, accuracy, and flexibility across all business units.
2. Self-service reporting
Users to utilize defined and governed metrics, product/location dimensions, and attributes as needed, to allow business analysis with recommendations for improvement.
3. Drill-down capability
The integrity of data is maintained as the user can drill down to the lowest level to uncover or discover.
4. Exception reporting
The ability for users to create exception reports to help direct focus and attention on meaningful insights.
Expected user experience & common data challenges
The FP&A team and business partners, etc., want five things when they’re dealing with financial data analytics:
1. Speed
2. Accuracy
3. Consistency
4. Time savings
5. Flexibility
Some of the most common data challenges that teams experience include:
- Too much ETL.
- Slow refresh times.
- Poor query responses.
- No actionable insights.
- No self-service.
Have a look through those challenges and ask yourself if your organization is currently battling with one or more of them.
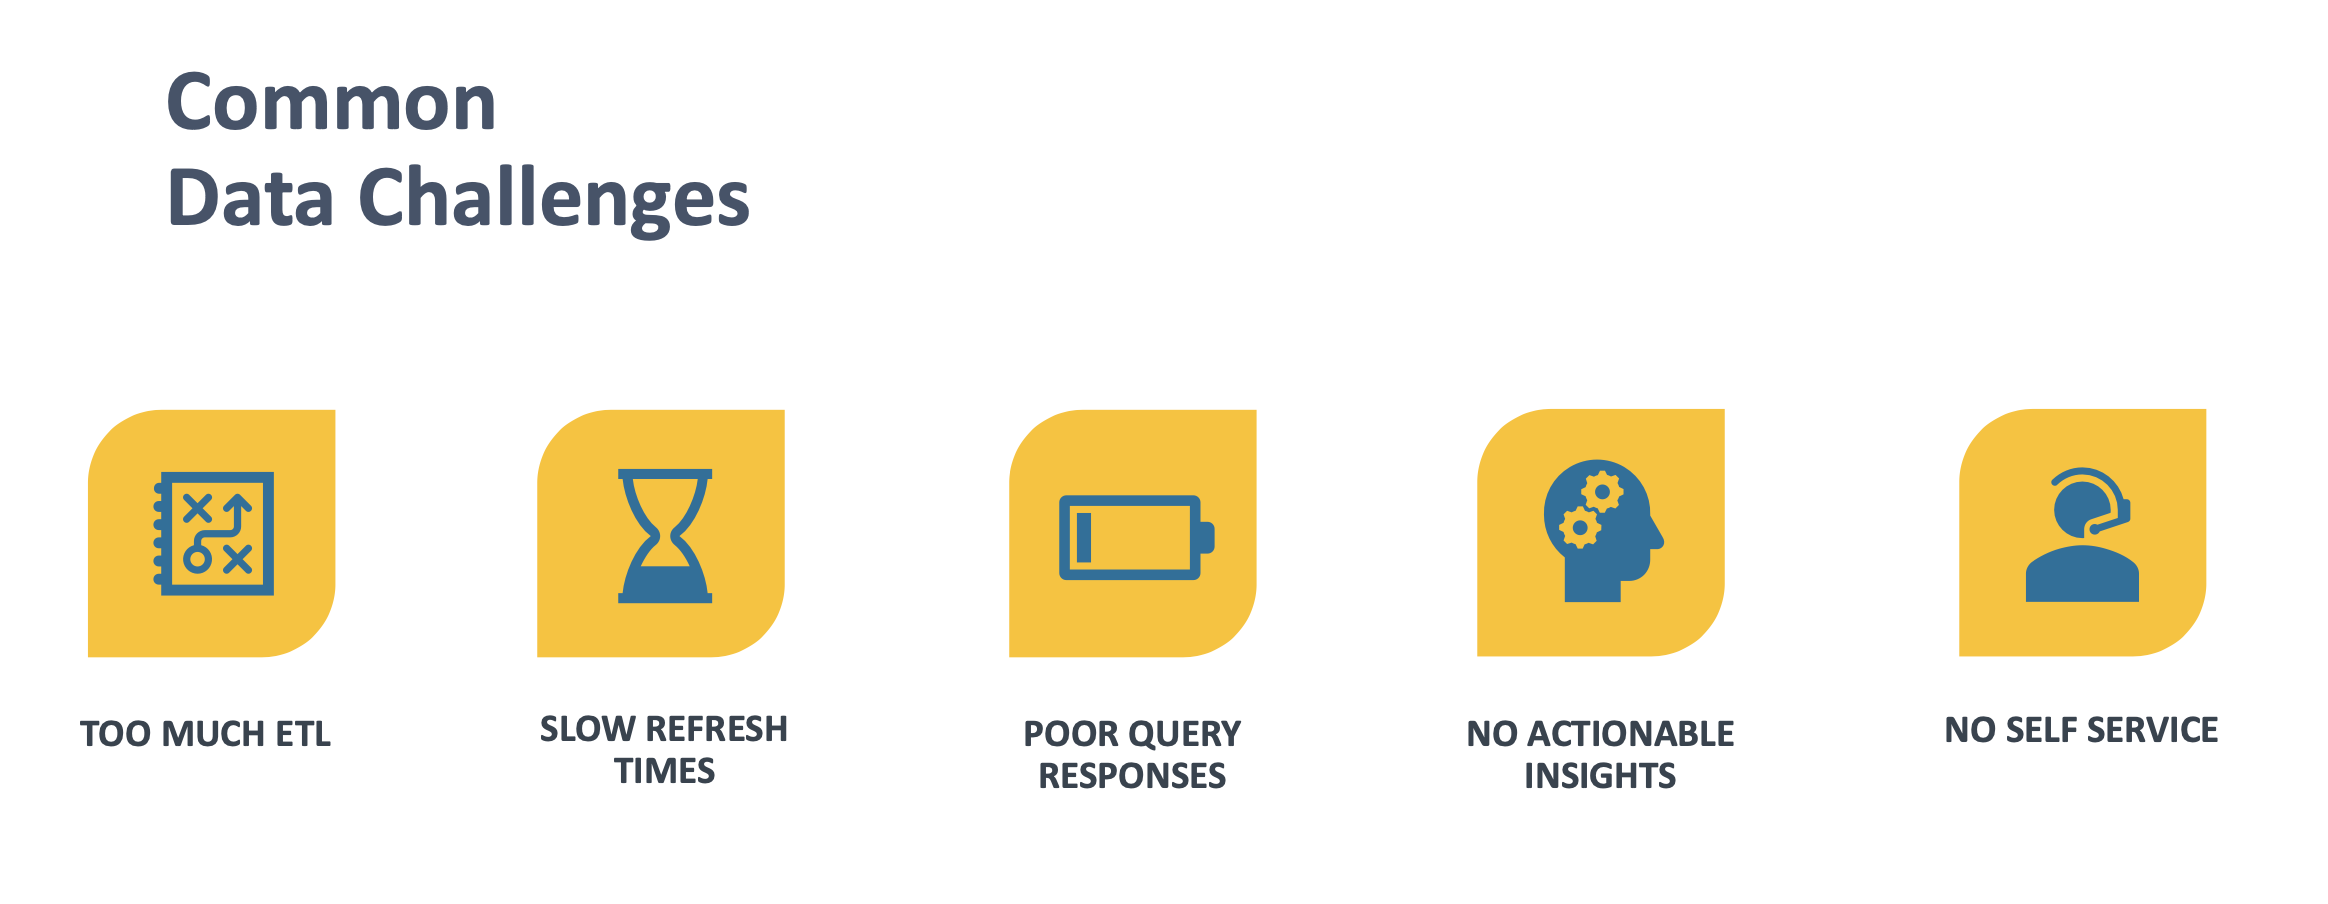
From an FP&A perspective, one of the biggest challenges is having no actionable insights to work with. In the past, this was a very real issue in most organizations because the data was either not physically available, or it cost too much, or by the time we got the data, it just wasn’t timely.
Nowadays, I’d argue that the data war has been won because the data is now basically free to access, it’s immediate and unlimited. The problem, though, is that it doesn't help the organization make better, faster, and smarter decisions.
It’s great that we have access to the data but it’s not enough. We need to take data and convert it into insights, which is different than information. The business needs actionable insights to create enough knowledge to make better, faster, and smarter decisions.
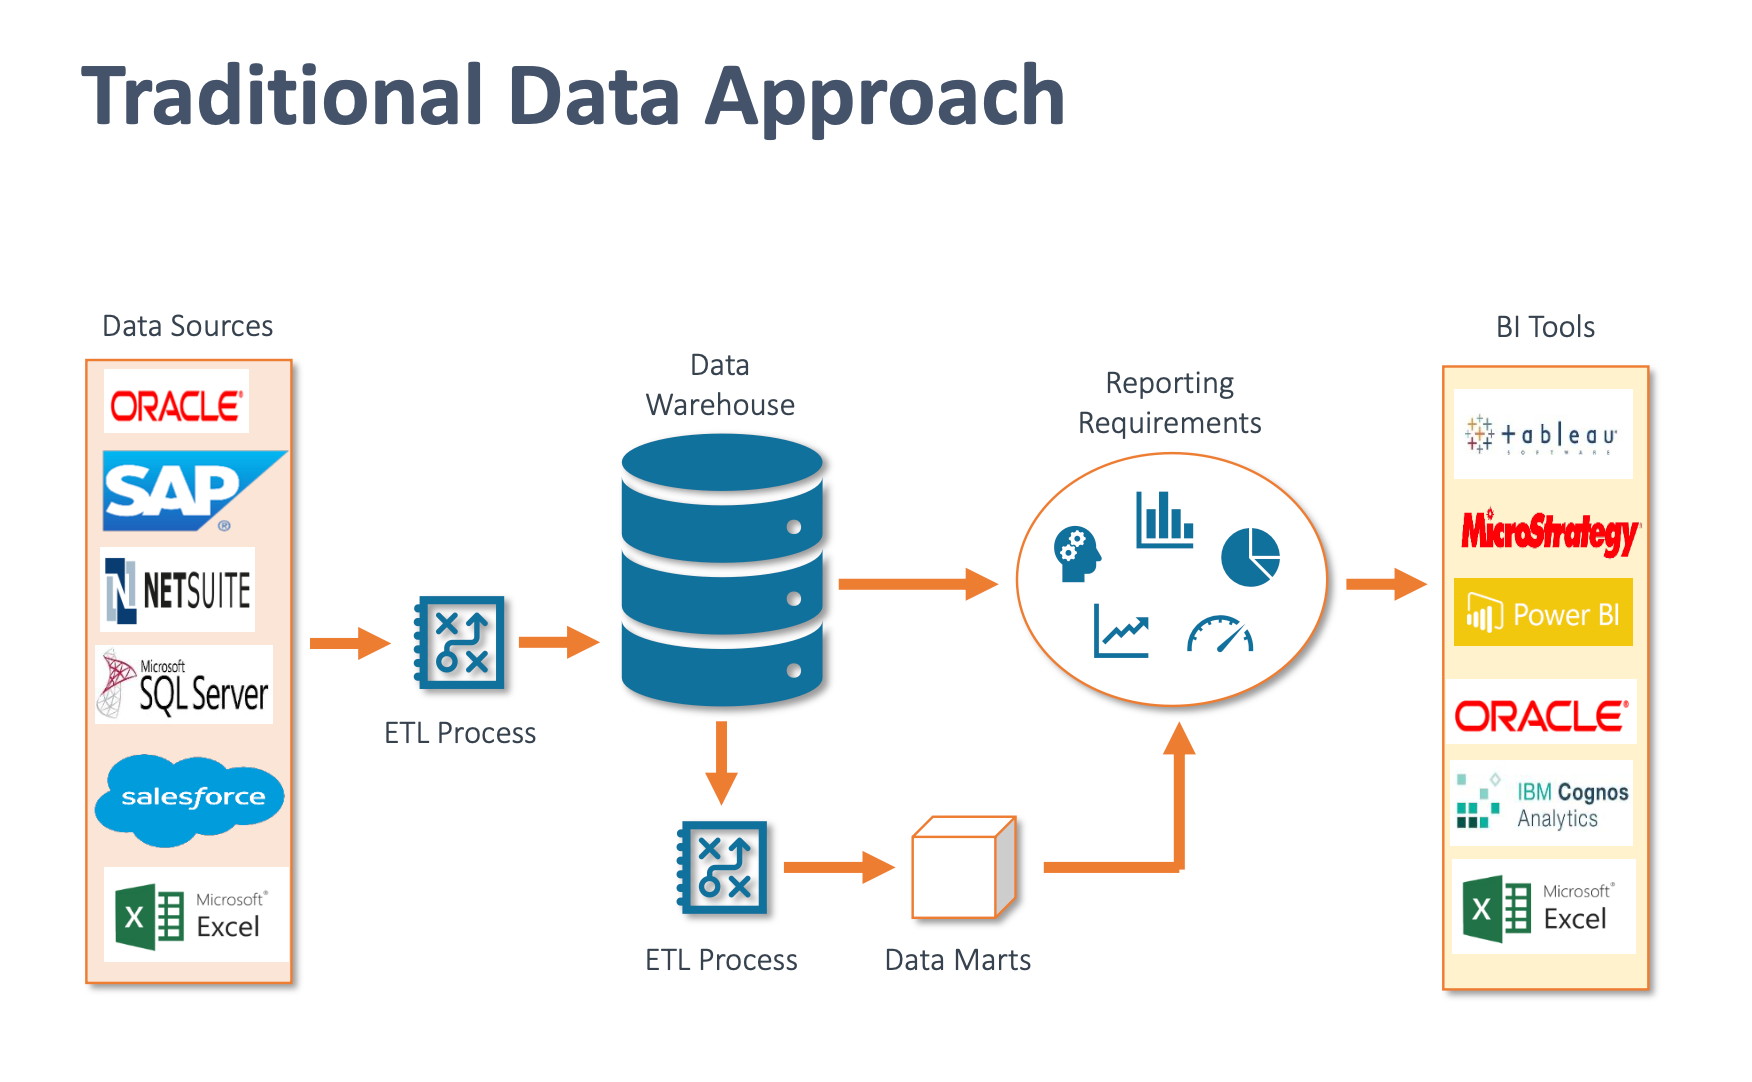
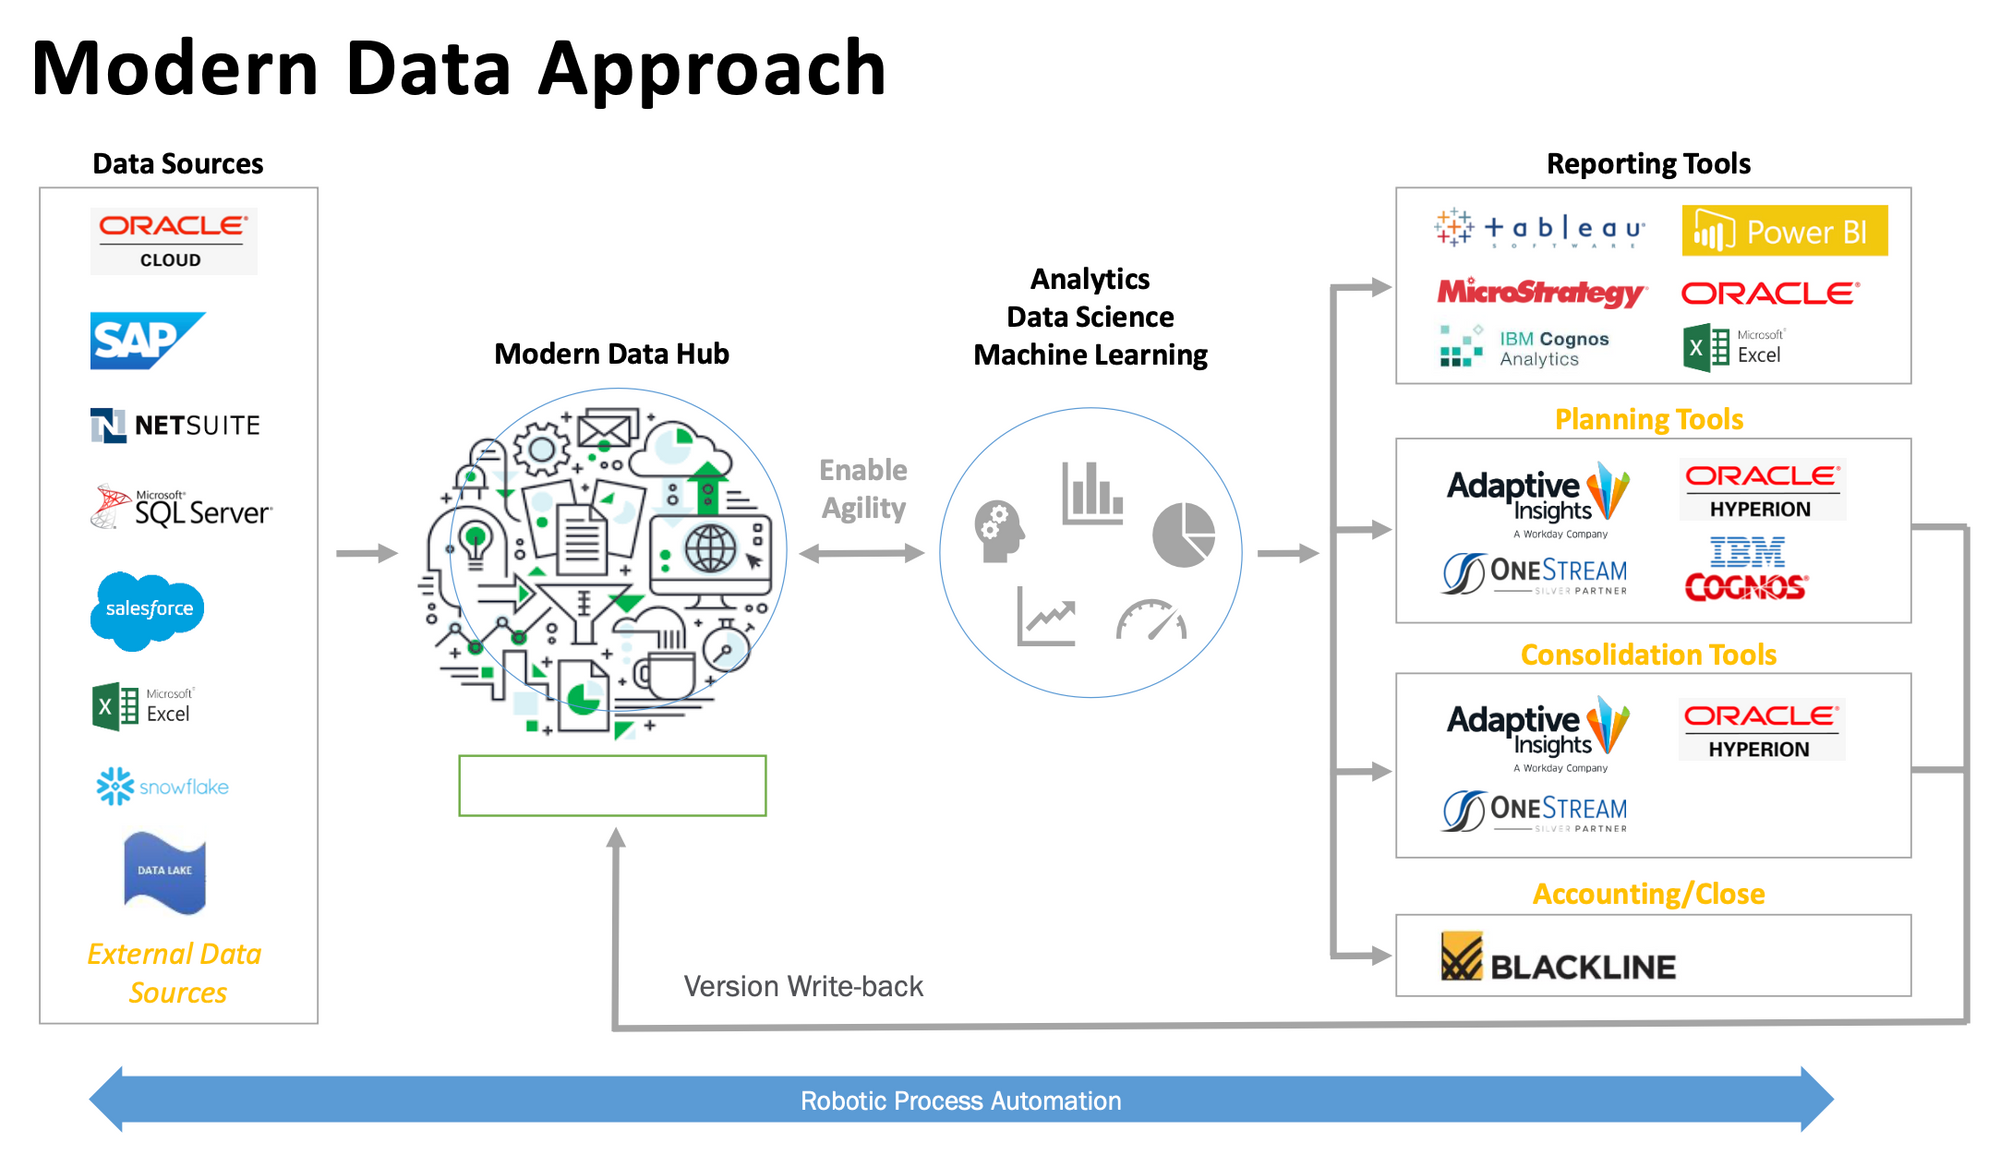
Traditional data analysis approach vs modern data approach
Technology is driving a lot of our enhancements and our ability to do higher levels of finance data analytics.
Here are a few slides showing how the data approach has evolved from traditional methods to a more modern data approach:
The game changer: Direct Data Mapping
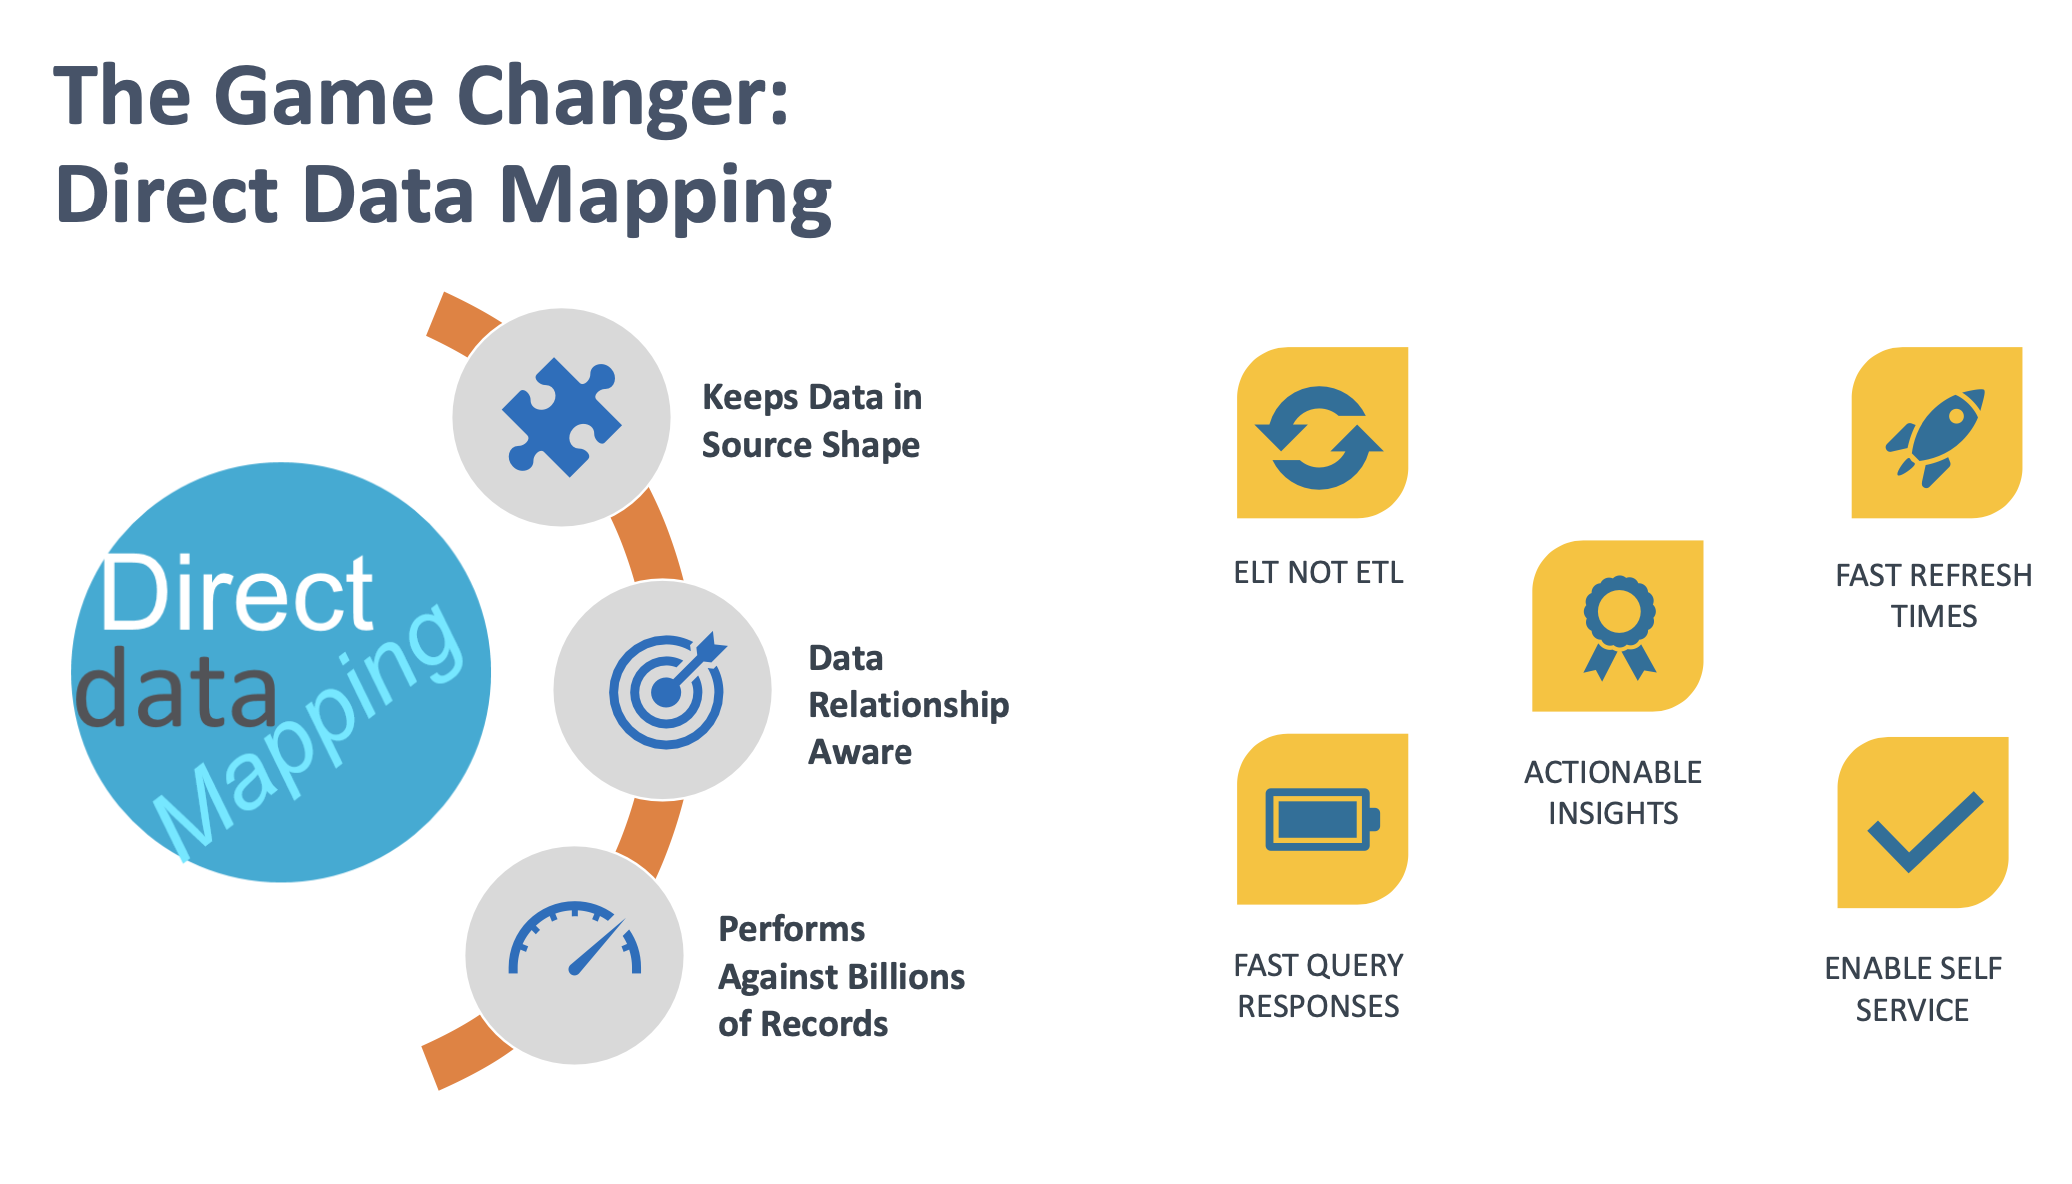
Direct data mapping allows you to leave data in its source form. We can therefore pull out the pieces of data that we want, making it data relationship aware.
When you make one change, you can make the same change throughout the entire system. It performs against billions of records, resulting in fast refresh times, fast query responses, and easy access to actionable insights on time.
Another great thing about direct data mapping is that it enables self-service and it's ELT versus ETL.
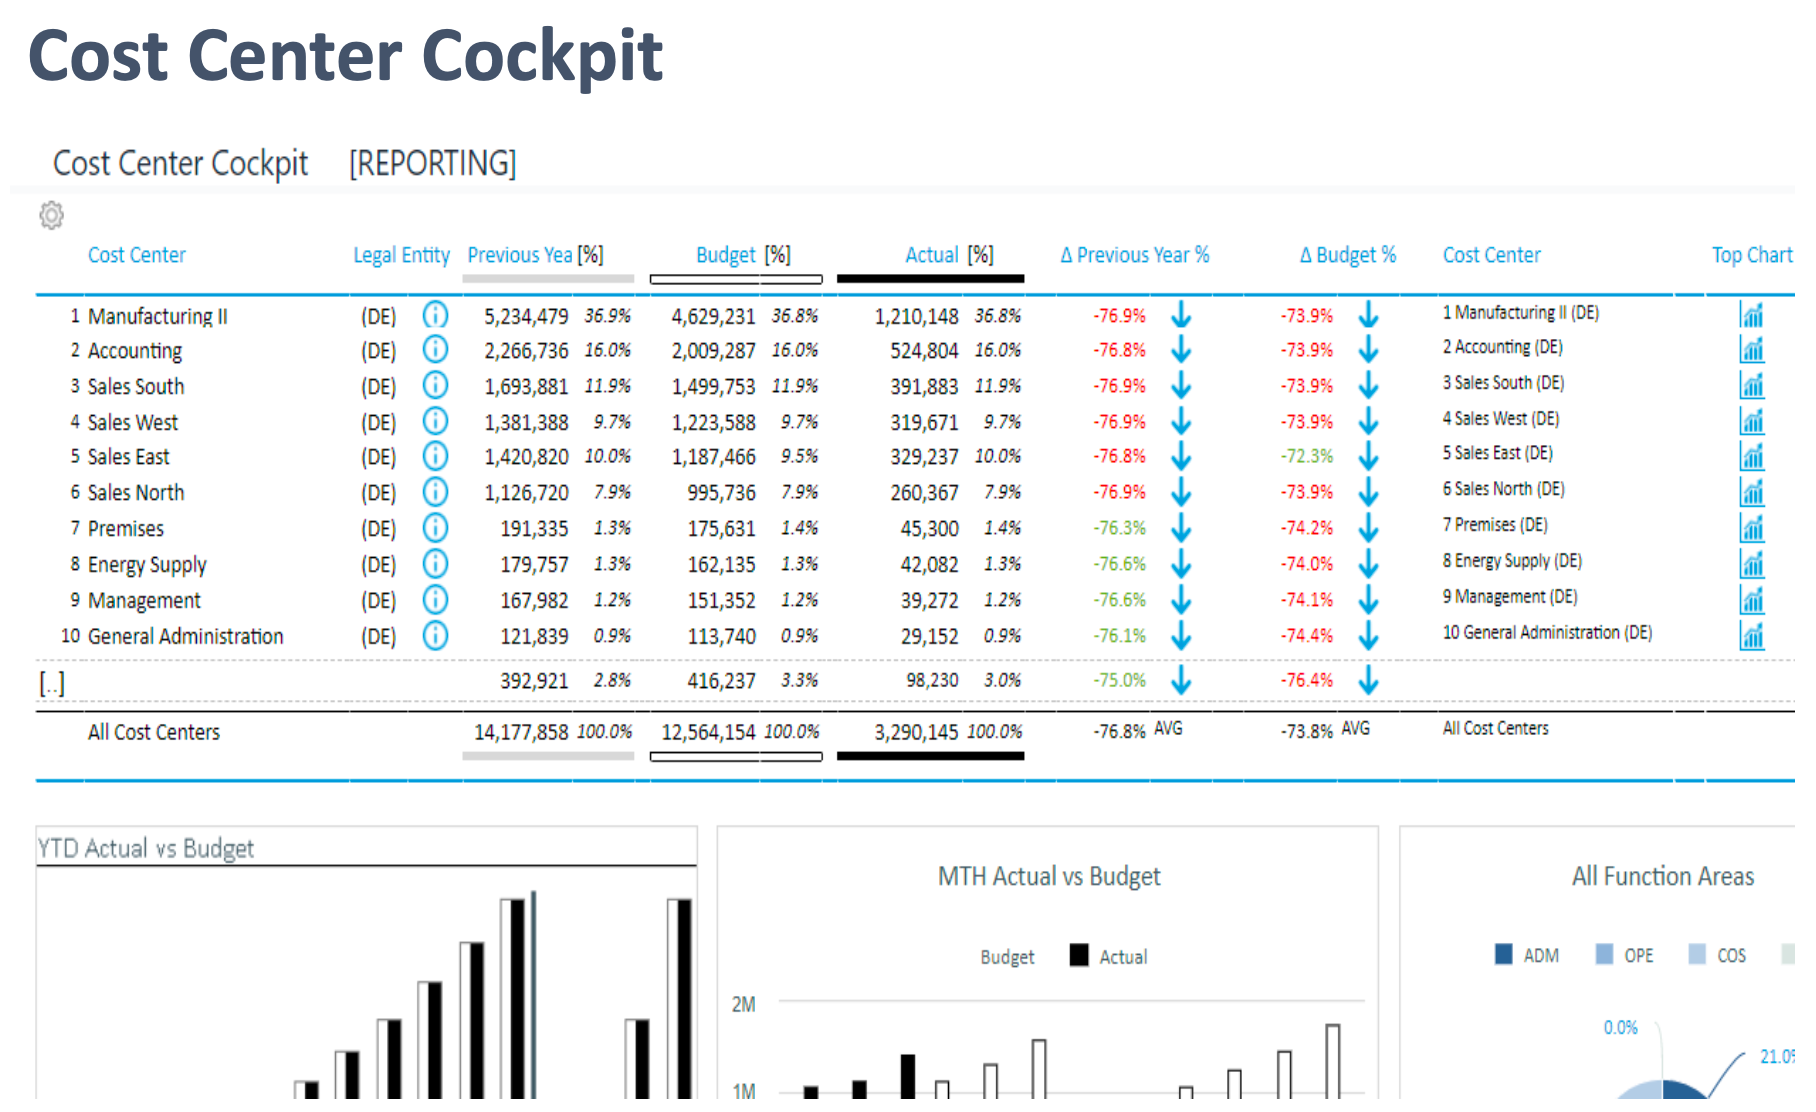
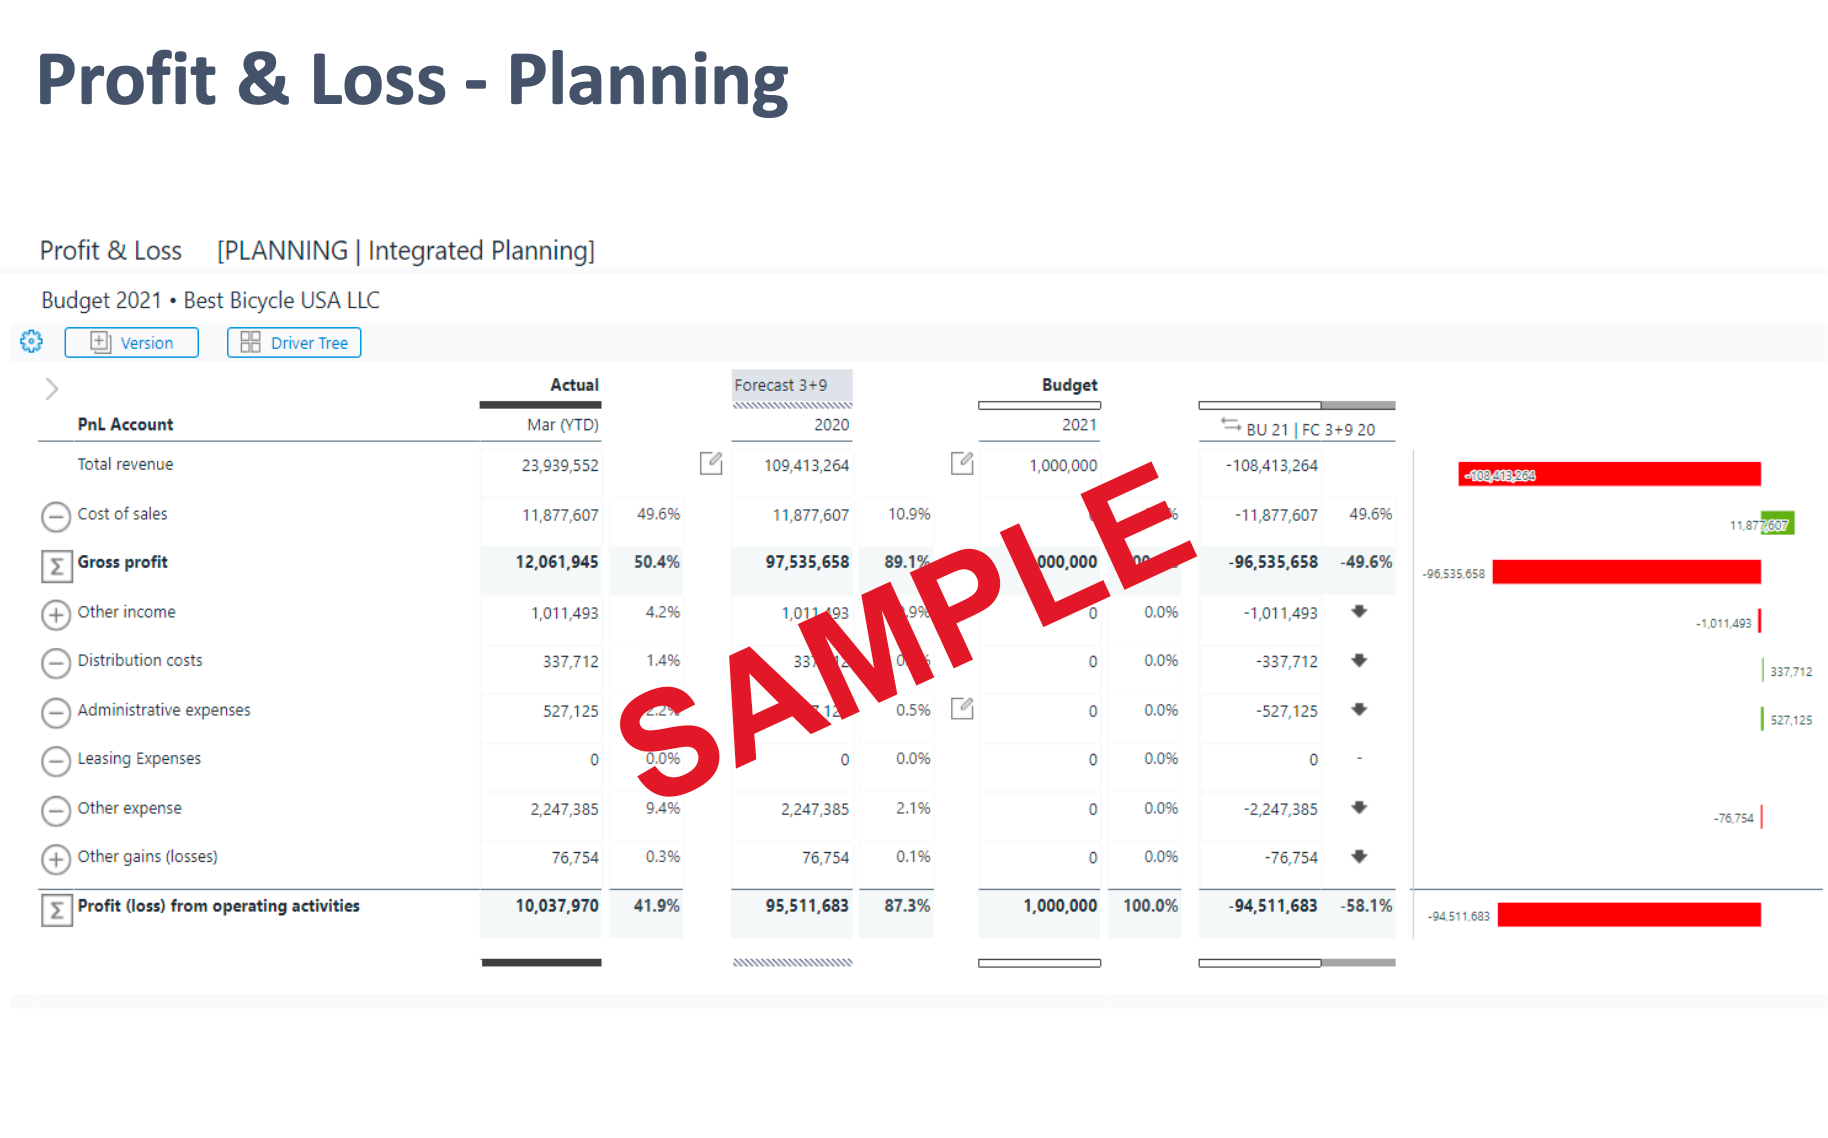
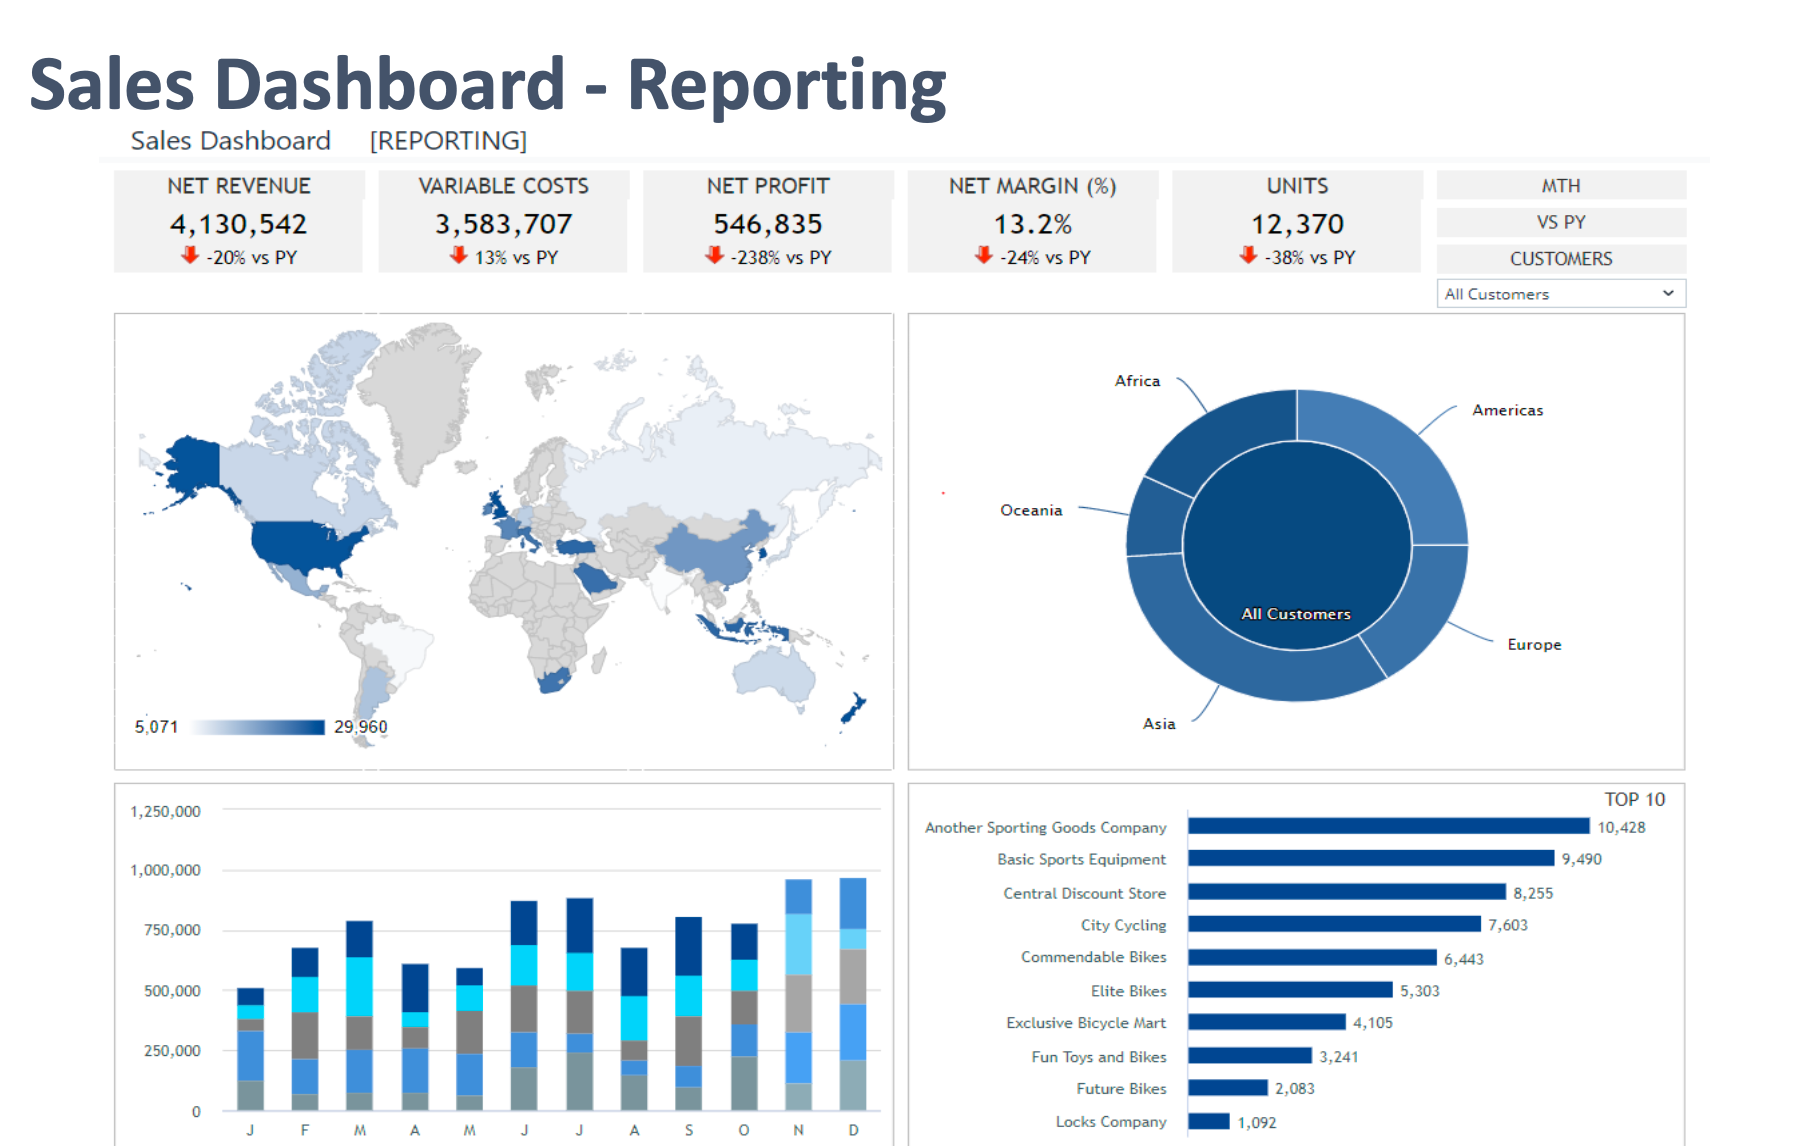
As FP&A professionals, we want to access our data as quickly as possible and in real time. So, here are a few snapshot examples of the type of reports that we’d like to have when we’re getting our analysis.
Data visualization
It’s great to do the analysis, but we've got to be able to tell the story with data visualization storytelling.
For example, my team can do the greatest analysis that's available, but if they present it to me in Danish, it doesn't mean anything because I don't speak Danish. So, a part of the onus on FP&A is being able to tell the story.
The international communication standards advise that when presenting data, remember that similar things should look similar, and different things should look different. This is a semantic notation for better report comprehension.
Here’s an example of dashboards with a semantic notation:
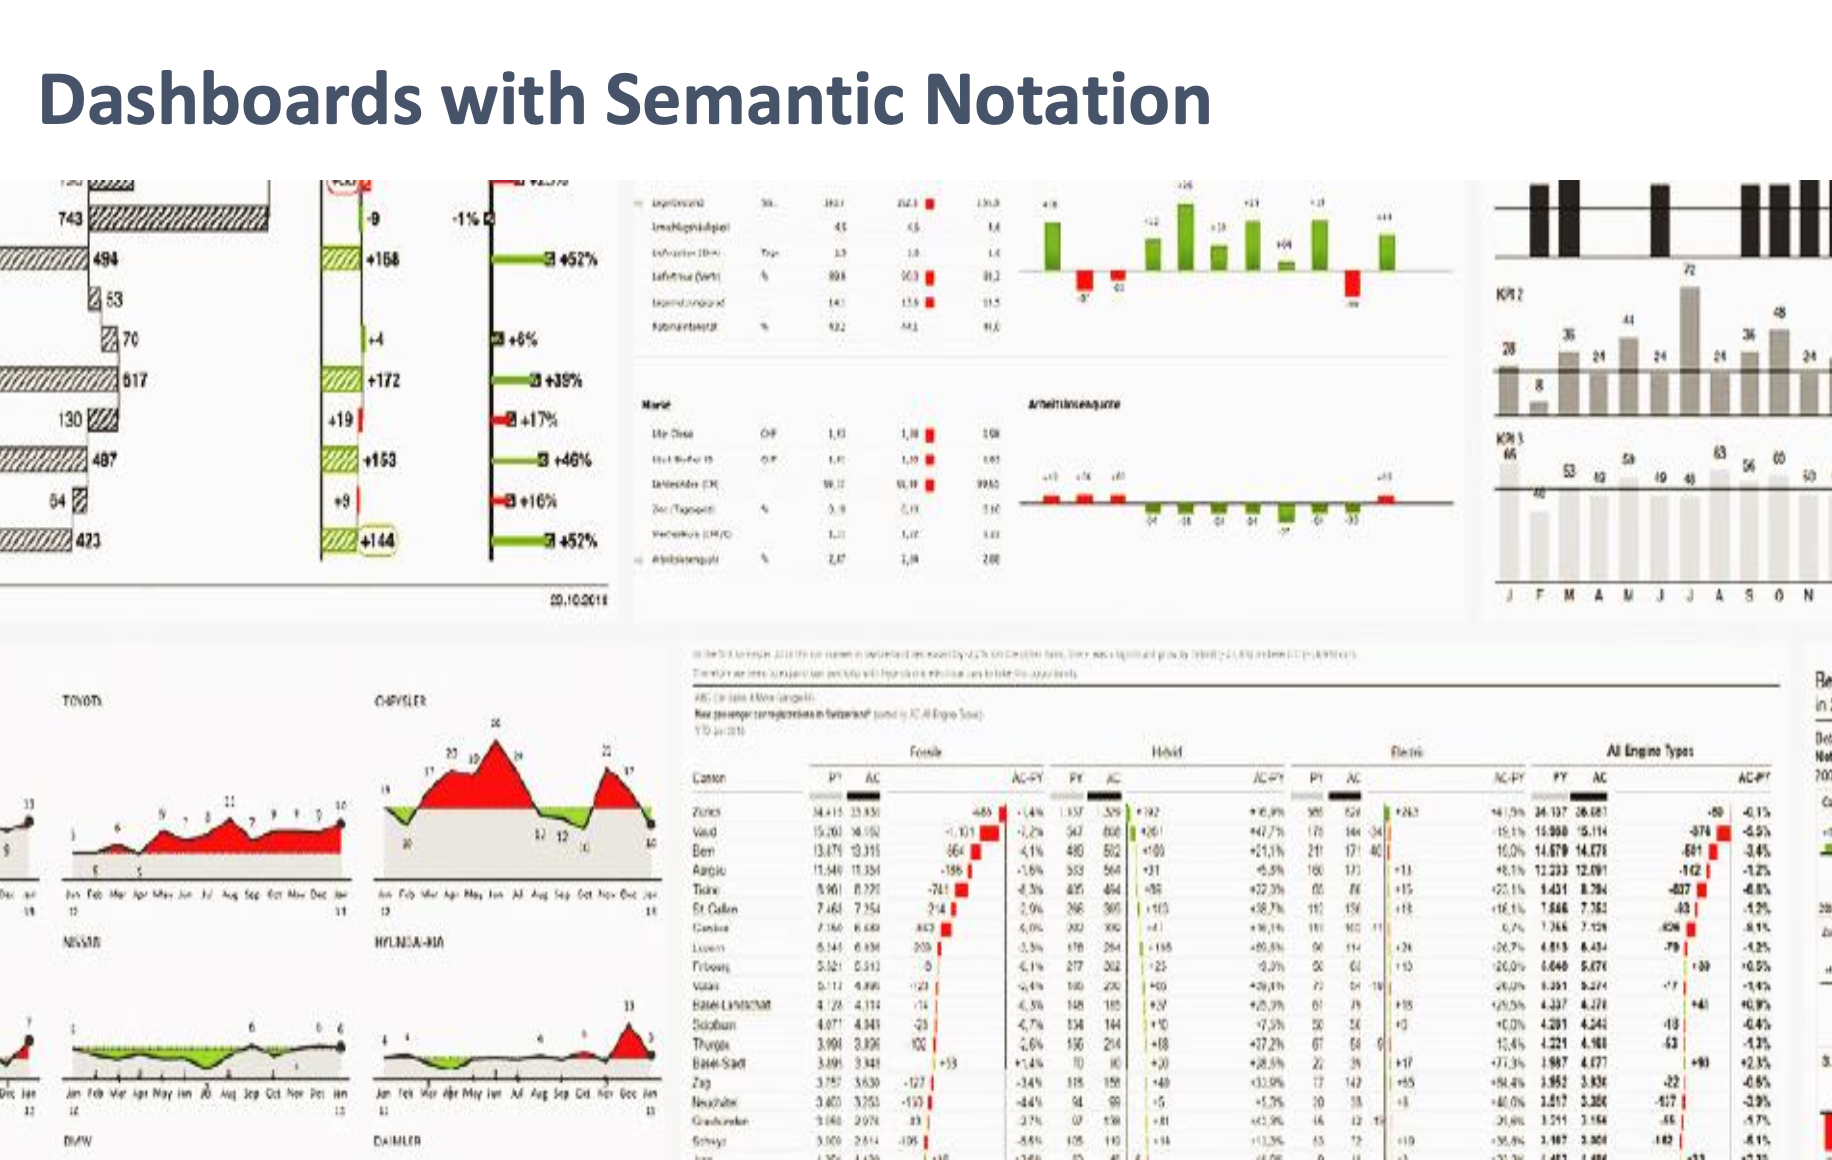
Our research showed that when people consume things from a reporting system that uses a common platform, their error rate of reading the information drops by 61%, and the amount of time it takes for them to understand that data drops by 46%.
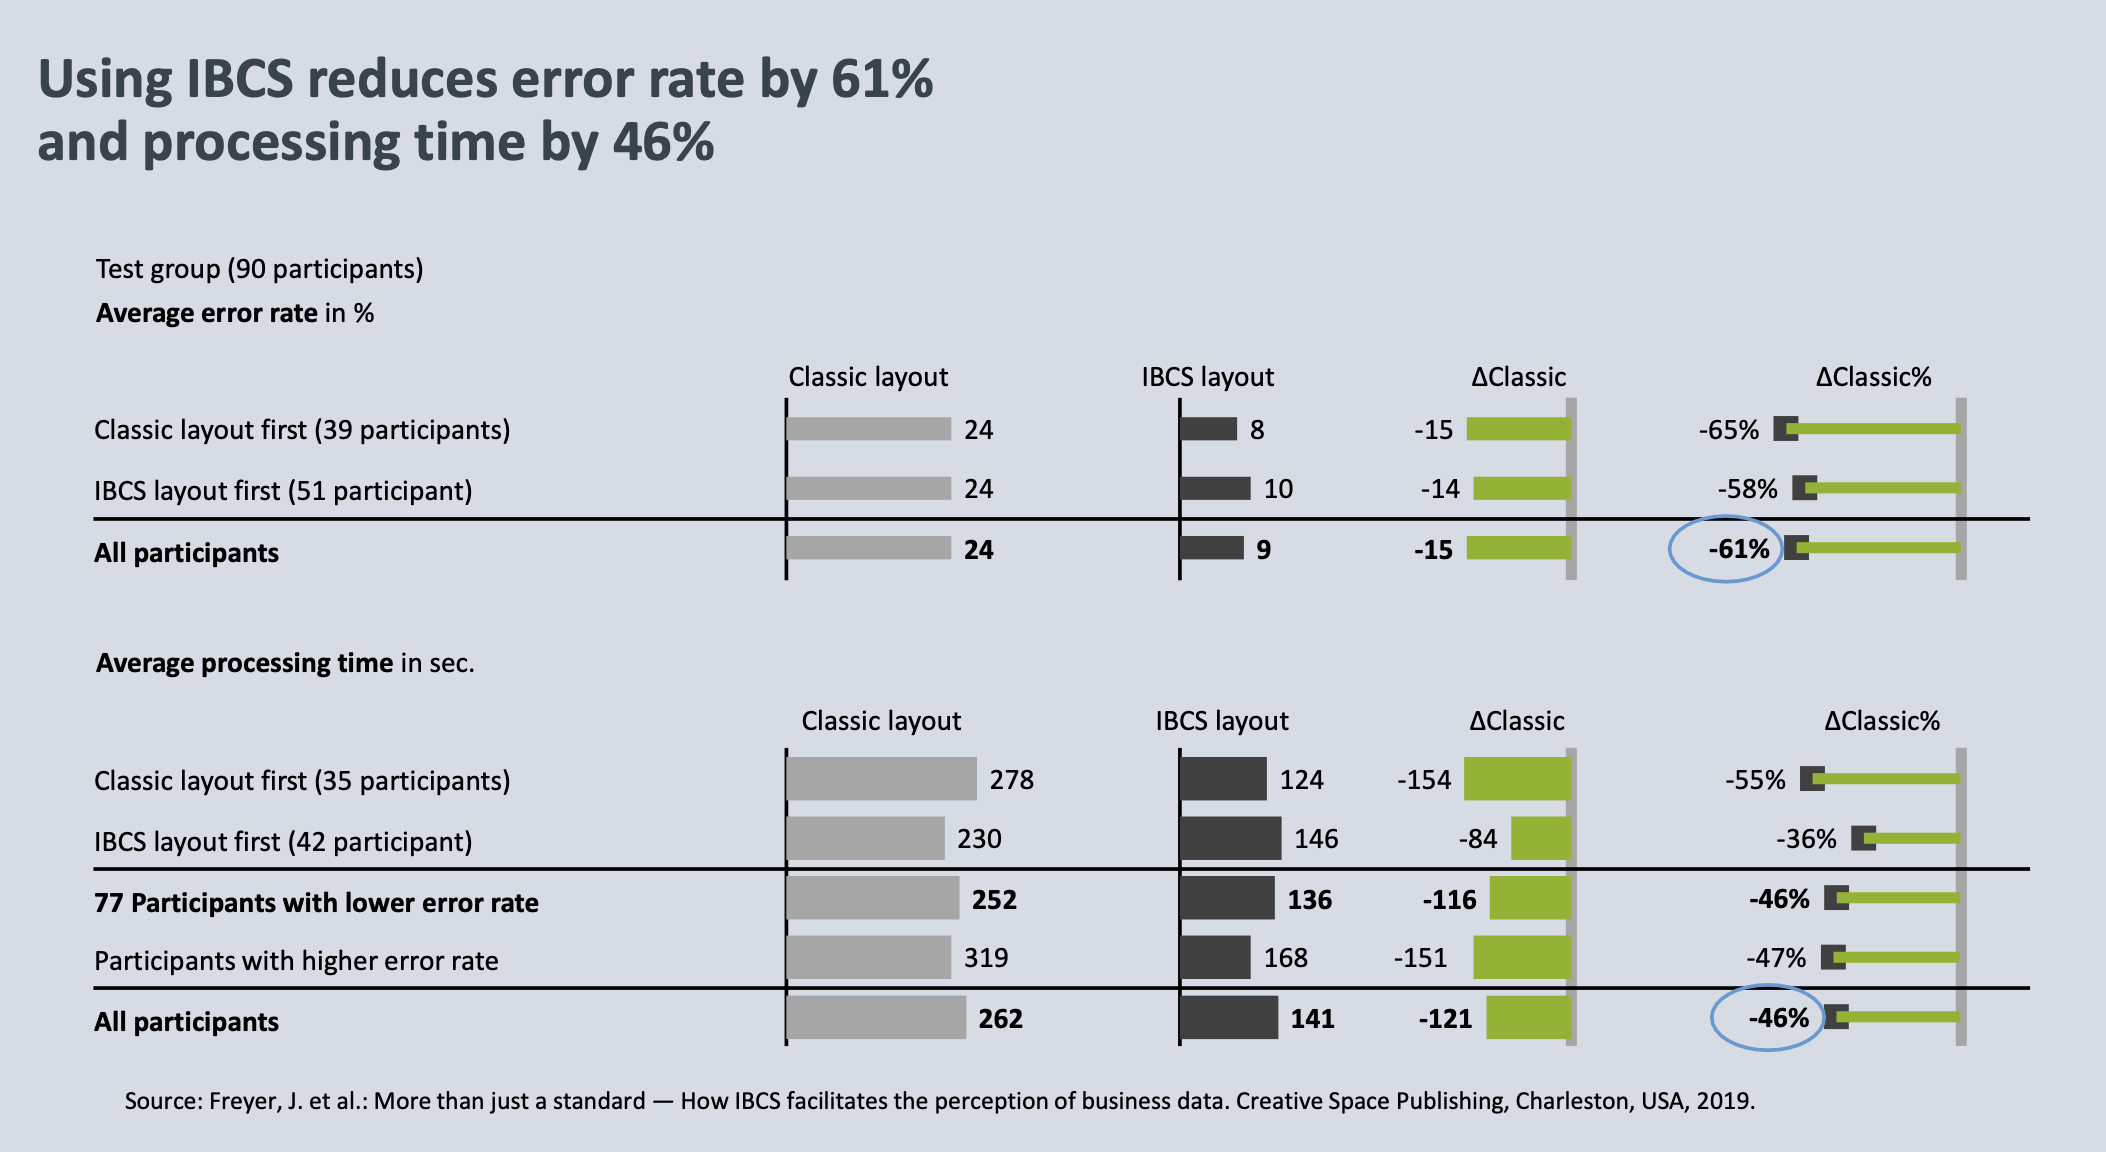
The main takeaway here is that there's a much better way to create your dashboards, reports, and presentations.
Financial data analytics maturity model
What type of financial data analytics do you generate primarily?
- Descriptive
- Diagnostic
- Predictive
- Perspective
- Cognitive/self-learning
The reason I ask is that it’ll help you place your organization in the analytics maturity model below more accurately.
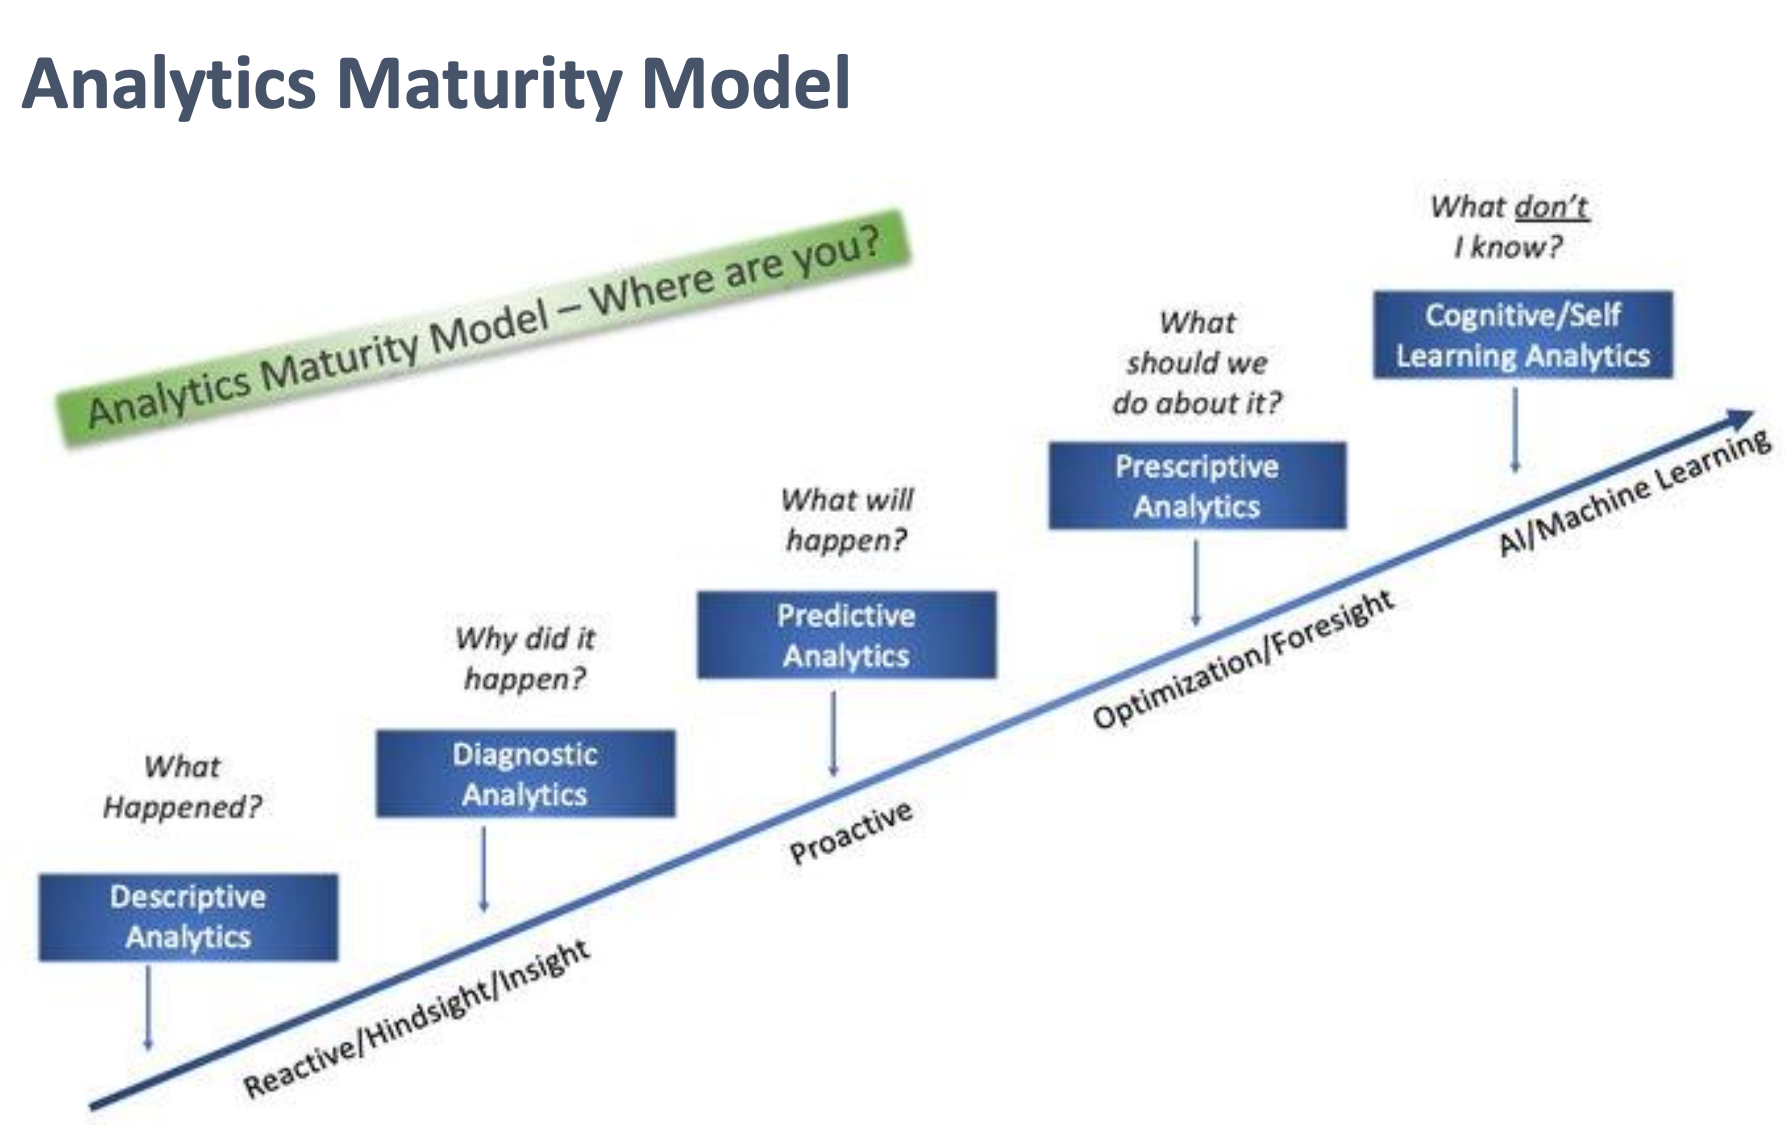
Understanding where your company belongs within this model will help you better understand what you need to do to improve. It helps you to see where you are now, what happened, why did it happen, what will happen next, what should you do about it, and perhaps more importantly, what don’t you know?
Descriptive and diagnostic analytics is historically where we've been in FP&A. It’s a little more on the reactive side, it’s the hindsight and some insight. It tells us what happened and where it happened.
But you want to move to predictive analysis because it’s proactive, it helps the business understand what will happen. Beyond that, is moving into prescriptive analytics, which means you can better influence the company and positively impact top-line growth using optimization and foresight.
We've got the people, tools, and processes and if we've got the right mindset, the organization can have whatever level of analytics it wants, as long as it's willing to invest.
Here’s a look at the bigger picture of the analytics journey:
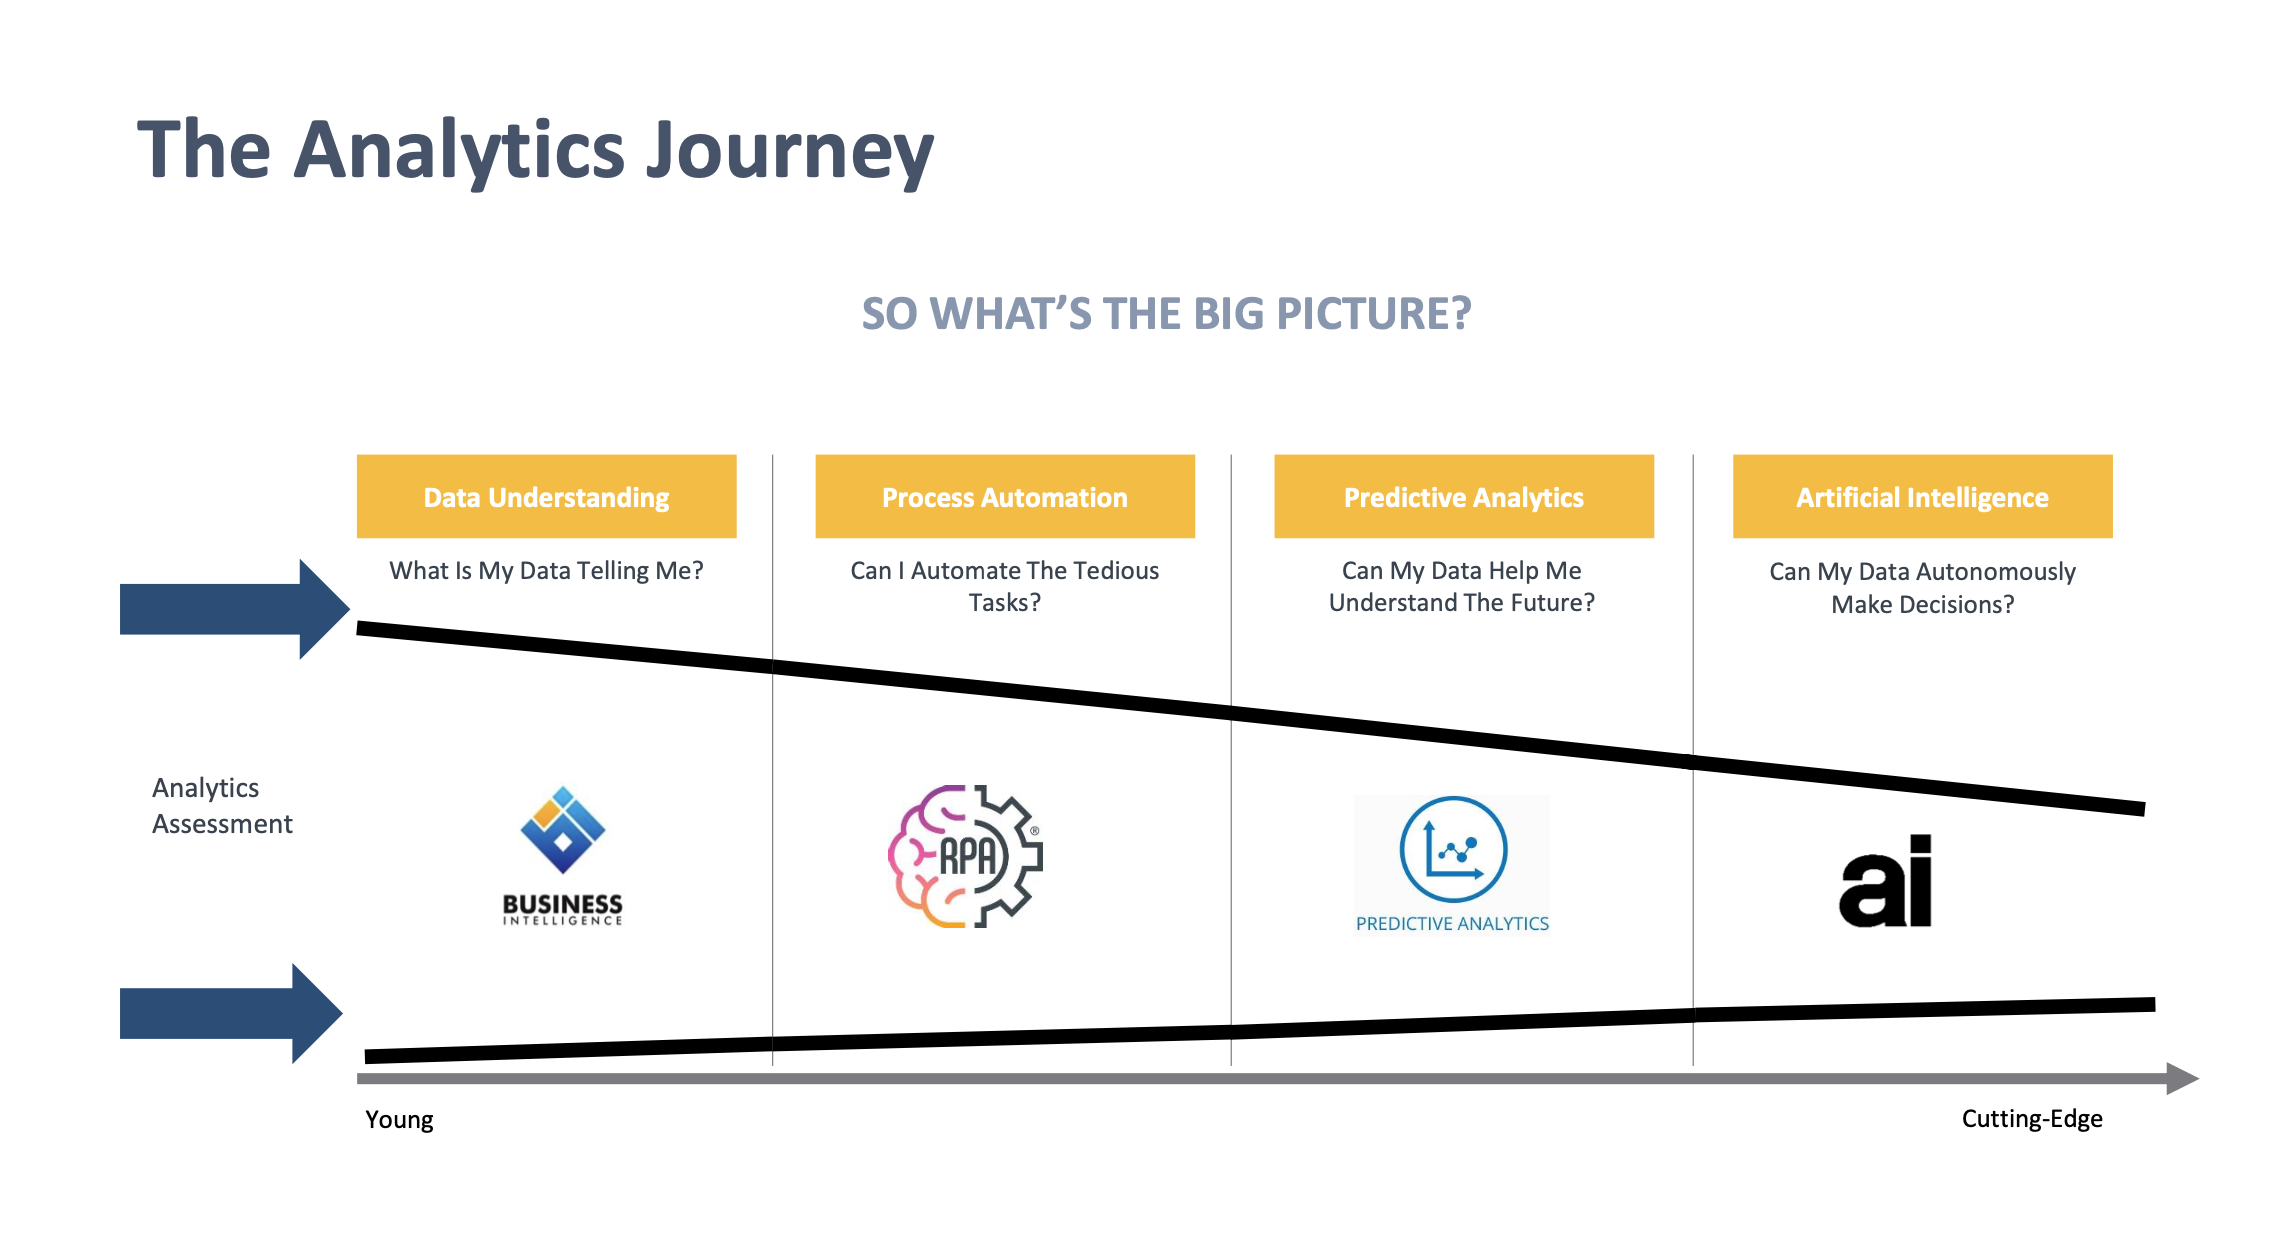
In case you needed reminding, here are a few key reasons why data analytics is so important in the ‘new normal’ and beyond:
- Data Analytics is increasingly critical during times of crisis.
- Organizations are using data more often than before.
- Organizations are reporting an increased need for data-driven insights than before.
- Organizations are reporting they are increasing their spend on data analytics.
The new normal: Forecasting
When Covid-19 happened, we were at the onset of a global health crisis. For many organizations, it was like a bank of fog that rapidly and unexpectedly engulfed everything in its path.
All of your tried-and-true navigation skills, processes, and how you would usually assess risks and opportunities were taken away and you had to rely on new ways to steer the organization on the right course.
Forecasting in the fog wasn’t easy and suddenly, the models FP&A teams were using during Covid-19 were no longer useful for them. The reason is, having 20 years of history wasn't going to tell you about what's going to happen tomorrow or the next day.
FP&A teams have been forced to change the cadence and many FP&A specialists are forecasting a lot quicker and perhaps more frequently than we have in the past. But why is forecasting so important in the ‘new normal’ and beyond?
I believe there are three main reasons. Firstly, the need to know has never been greater. Secondly, the world we are operating in is in a constant state of flux. And thirdly, the drivers to the success of our organizations are constantly changing in importance.
The world is constantly changing. So, our ability to be agile, and to forecast “on the fly” has never had a greater premium.
Best practices in forecasting
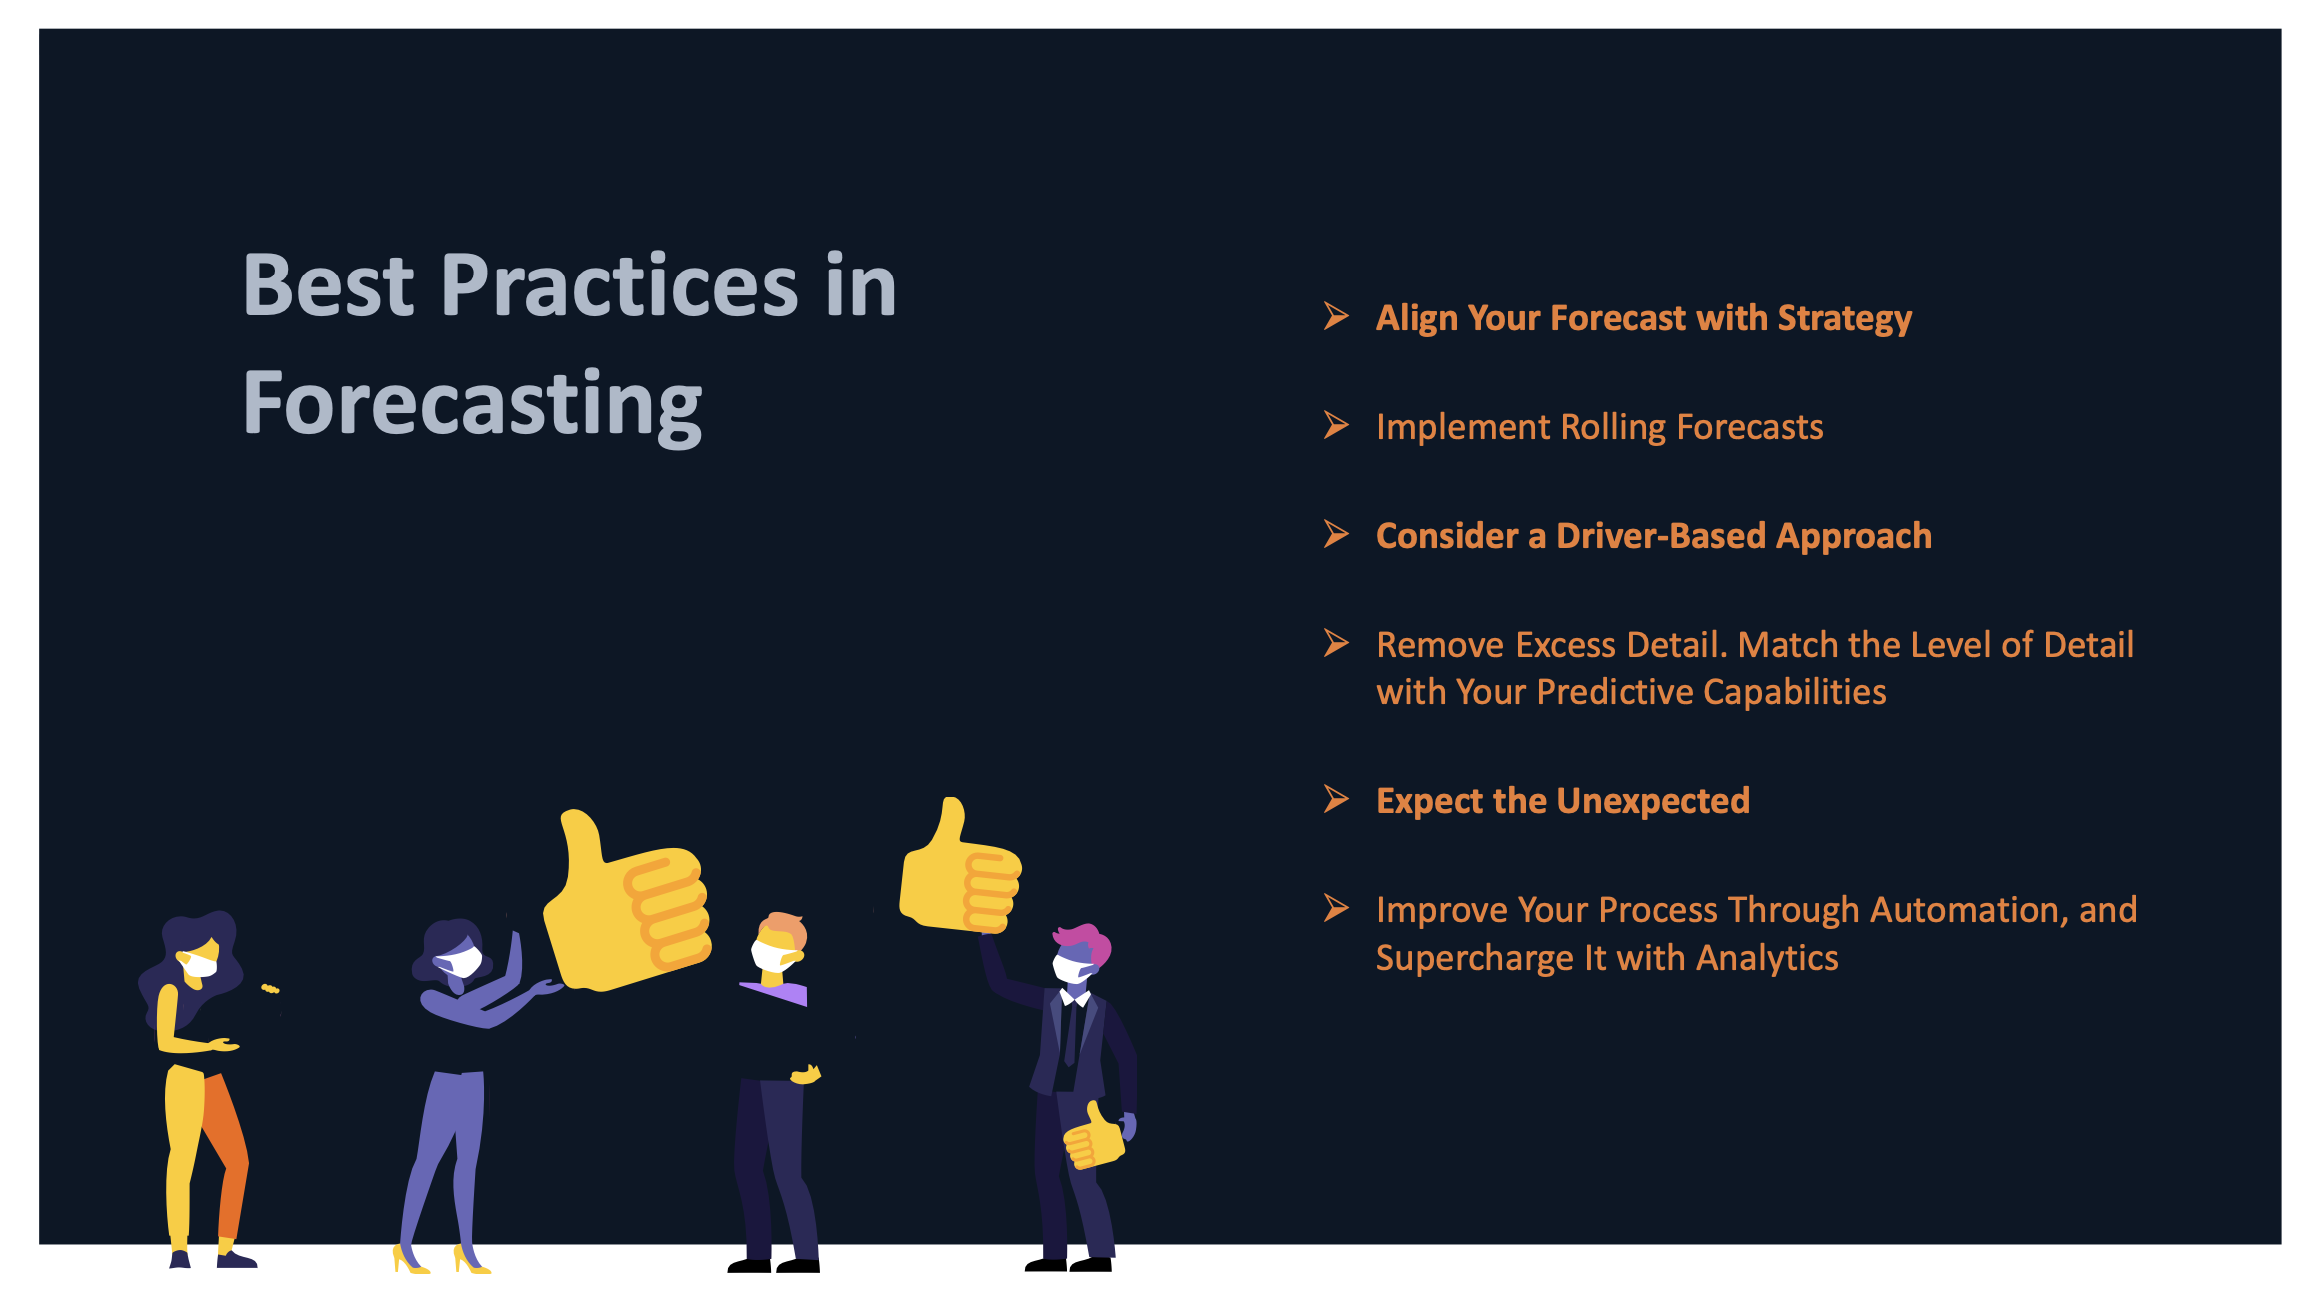
Here are a few tips to help you leverage forecasting to steer through times of uncertainty and navigate this new normal we’ve all found ourselves in:
- Align your forecast with the strategy.
- Implement rolling forecasts.
- Consider a driver-based approach.
- Remove excess detail. Match the level of detail with your predictive capabilities.
- Expect the unexpected.
- Improve your process through automation, and supercharge it with analytics.

The new normal: Scenario planning
In hindsight, many people around the world look back at what happened with the pandemic and wonder whether anyone could’ve predicted it.
So, how could FP&A professionals have predicted both the pandemic occurring and the scope and scale of its impact?
The simple answer is that we’re not fortune tellers. We don’t try to predict the future. Rather, FP&A professionals are about preparing for a range of possible outcomes, attaching a likelihood or probability of each outcome, and developing corresponding strategies to maximize the long-term benefit of the organization.
But how do you mitigate uncertainty? Well, it's with planning, planning, and more planning.
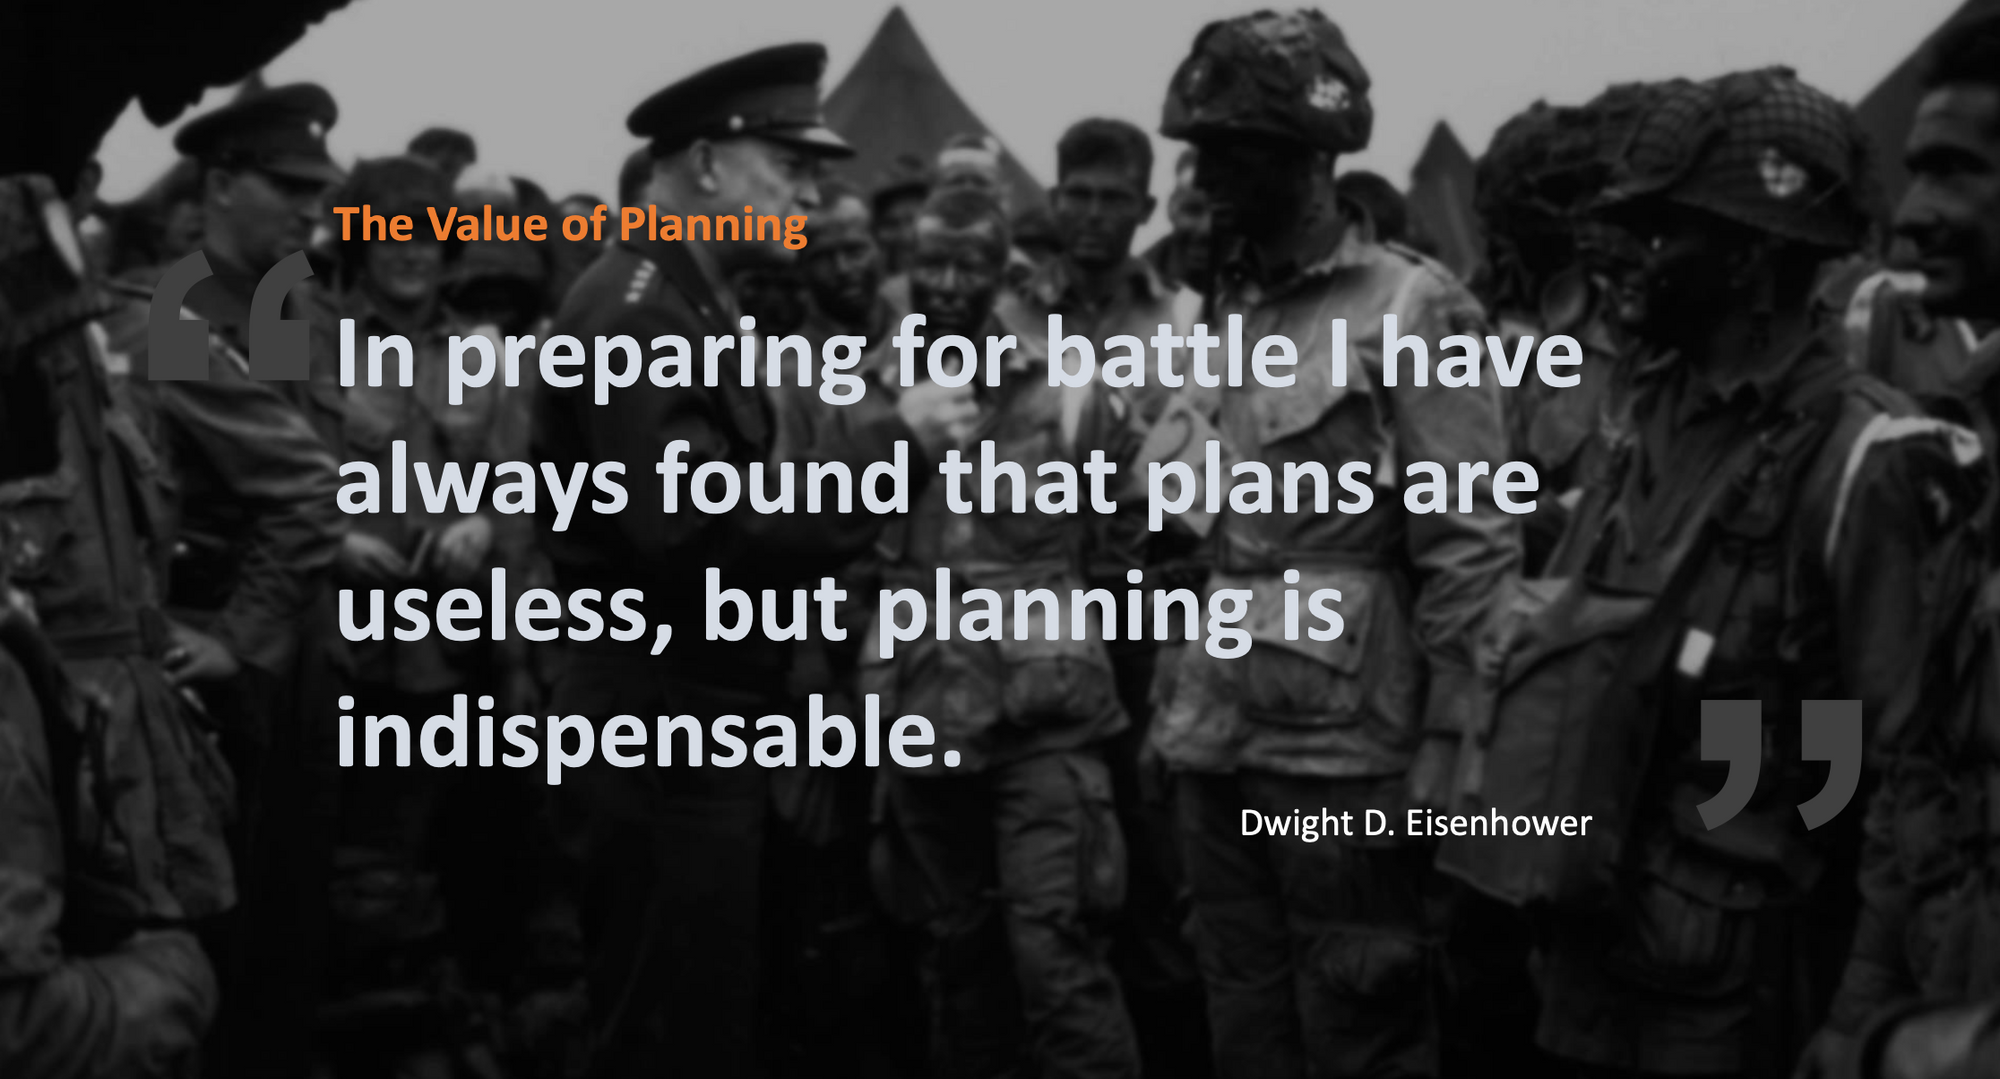
Types of scenario planning include:
- Quantitative scenarios
- Operational scenarios
- Normative scenarios
- Strategic management scenarios
Scenario planning: actions to take vs actions to avoid
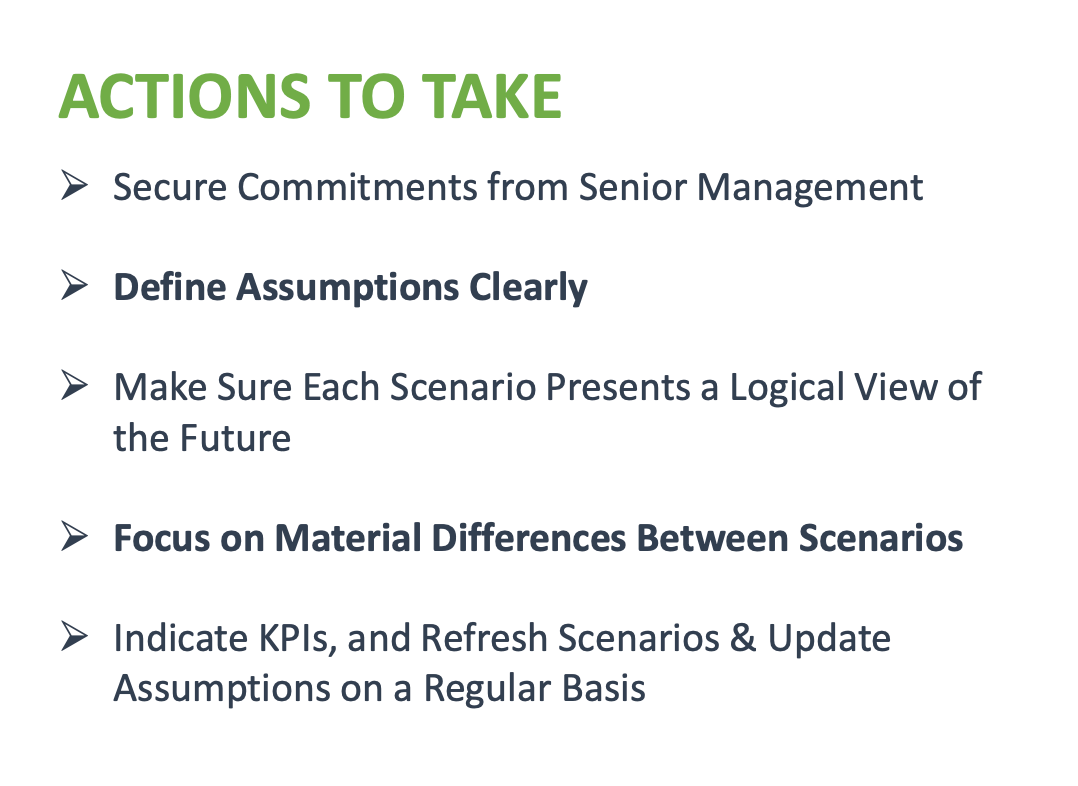
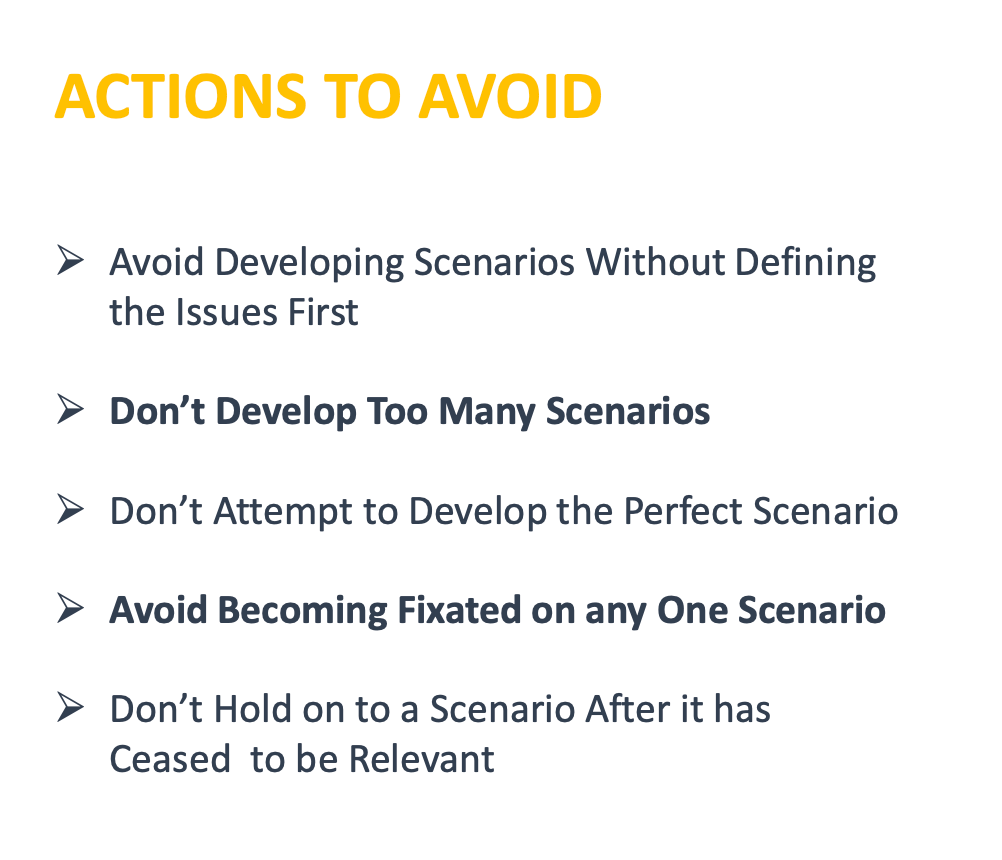
There are three key steps to better best-case worst-case scenario planning:
1. Identify critical triggers even amid uncertainty.
2. Develop multiple scenarios but keep it simple.
3. Build a nimble response strategy.
Furthermore, a few key best practices for successful scenario planning involve assembling the right team, getting the right data, modeling with basic scenarios, and providing a break-even analysis.

Why is scenario planning so important in the ‘new normal’ and beyond?
The ability to respond quickly and pivot to any given change in our environment is critical and requires robust scenario planning.
In this world of great uncertainty, knowing the most likely business scenarios permits organizations to maximize opportunities and minimize risks.
Knowing and understanding the most probable and possible business outcomes, enable organizations to focus on the likely and avoid wasting resources on the unlikely.
You can even think about scenario planning insurance for your business, in a way. It’s so cheap to plan versus how much it costs to react in a crisis.
Key takeaways
To truly thrive in the “New New Normal”, organizations need data analytics that:
➢ Keeps data in its source state
➢ Incorporates tools that are relationship aware
➢ Are able to perform against billions of records
Some other key takeaways include:
- Organizations must advance from simply providing Descriptive and Diagnostic Analytics to generating those mission-critical Predictive, Prescriptive, and ultimately Cognitive Analytics.
- The frequency of Forecasting will be greater in the “New New Normal.
- Organizations must leverage their People, Processes, Technology, and Mindset/Culture to meet this new reality.
- Organizations must run robust scenario planning platforms to maximize the opportunities and minimize the risks that our highly uncertain world continues to throw in our path.
About the author
Brian Kalish – Global Certified Corporate FP&A Professional
Brian Kalish is the Principal and Founder of Kalish Consulting, an Expert-in-Residence at eCapital Advisors and an Adjunct Professor at Florida International University. He has over 25 years of experience in Finance, FP&A, Treasury, and Investor Relations.
Brian is also a public speaker and addresses many of the most topical issues facing FP&A professionals today. He has spoken all over the world and is committed to building and connecting the global FP&A community. He continues to host FP&A roundtables and events in North America, Europe, Asia, and South America.


 Follow us on LinkedIn


