Microsoft has revealed a new era of analytics with the integration of Python in Excel. No more toggling between platforms or fiddling with add-ons, you can now manipulate and explore data in Excel using Python’s analytical and visualization libraries - all without having to install additional software.
“Today, we are excited to introduce the Public Preview of Python in Excel – making it possible to integrate Python and Excel analytics within the same Excel grid for uninterrupted workflow.” – Stefan Kinnestrand, General Manager of Modern Work at Microsoft.
In collaboration with Anaconda, Python in Microsoft Excel bridges the gap between the intuitive user-friendly interface of Excel and the intricate capabilities of Python, unlocking unprecedented possibilities for finance professionals.
So, if you’re as excited about this news as we are, keep reading to learn more about what’s possible, how Python in Excel works, how to use it in your role, and more.
Table of contents:
- How Python in Excel works
- What we know about the new =PY function
- How to use the PY function
- Using Python in Excel (finance applications)
- Collaboration abilities
- FAQs
How Python in Excel works
The integration of Python in Excel signifies a significant advancement in data analytics. With the introduction of the 'PY' function (more on that below), Excel now embeds Python's capabilities, allowing users to directly utilize its vast libraries for tasks like data visualization, machine learning, and advanced analytics, all within the familiar confines of an Excel workbook. This eliminates the need for separate installations or shifting between platforms, which is amazing news for anyone who regularly works with both tools.
A standout aspect of this integration is the ability to type Python code directly into an Excel cell. Once entered, the calculations are conducted securely within the Microsoft Cloud, and the results – whether they're data points, plots, or visualizations – are relayed back to the Excel worksheet. This seamless process allows users to pair Python's renowned data analysis tools with Excel's traditional features like formulas, charts, and pivot tables.
Excel's capability to source data has also been enhanced. Its built-in connectors and the Power Query feature streamline the process of importing external data into Python-activated workflows, optimizing the analytics process.
With Anaconda's Distribution operating on Azure, users have access to some of the most popular Python libraries, including pandas for data manipulation, statsmodels for statistical modeling, and tools like Matplotlib.
The best news, though, is that using Python in Excel is simple. You can access it directly from Excel without having to install or set up anything extra:
“Now you can do advanced data analysis in the familiar Excel environment by accessing Python directly from the Excel ribbon. No set-up or installation is required…
“Using Excel’s built-in connectors and Power Query, you can easily bring external data into Python in Excel workflows.” - Stefan Kinnestrand, General Manager of Modern Work at Microsoft.

What is the =PY function?
According to Microsoft, the new =PY function lets users seamlessly integrate Python's analytical capabilities into Excel's grid. It can be used just like any other Excel function or macro.
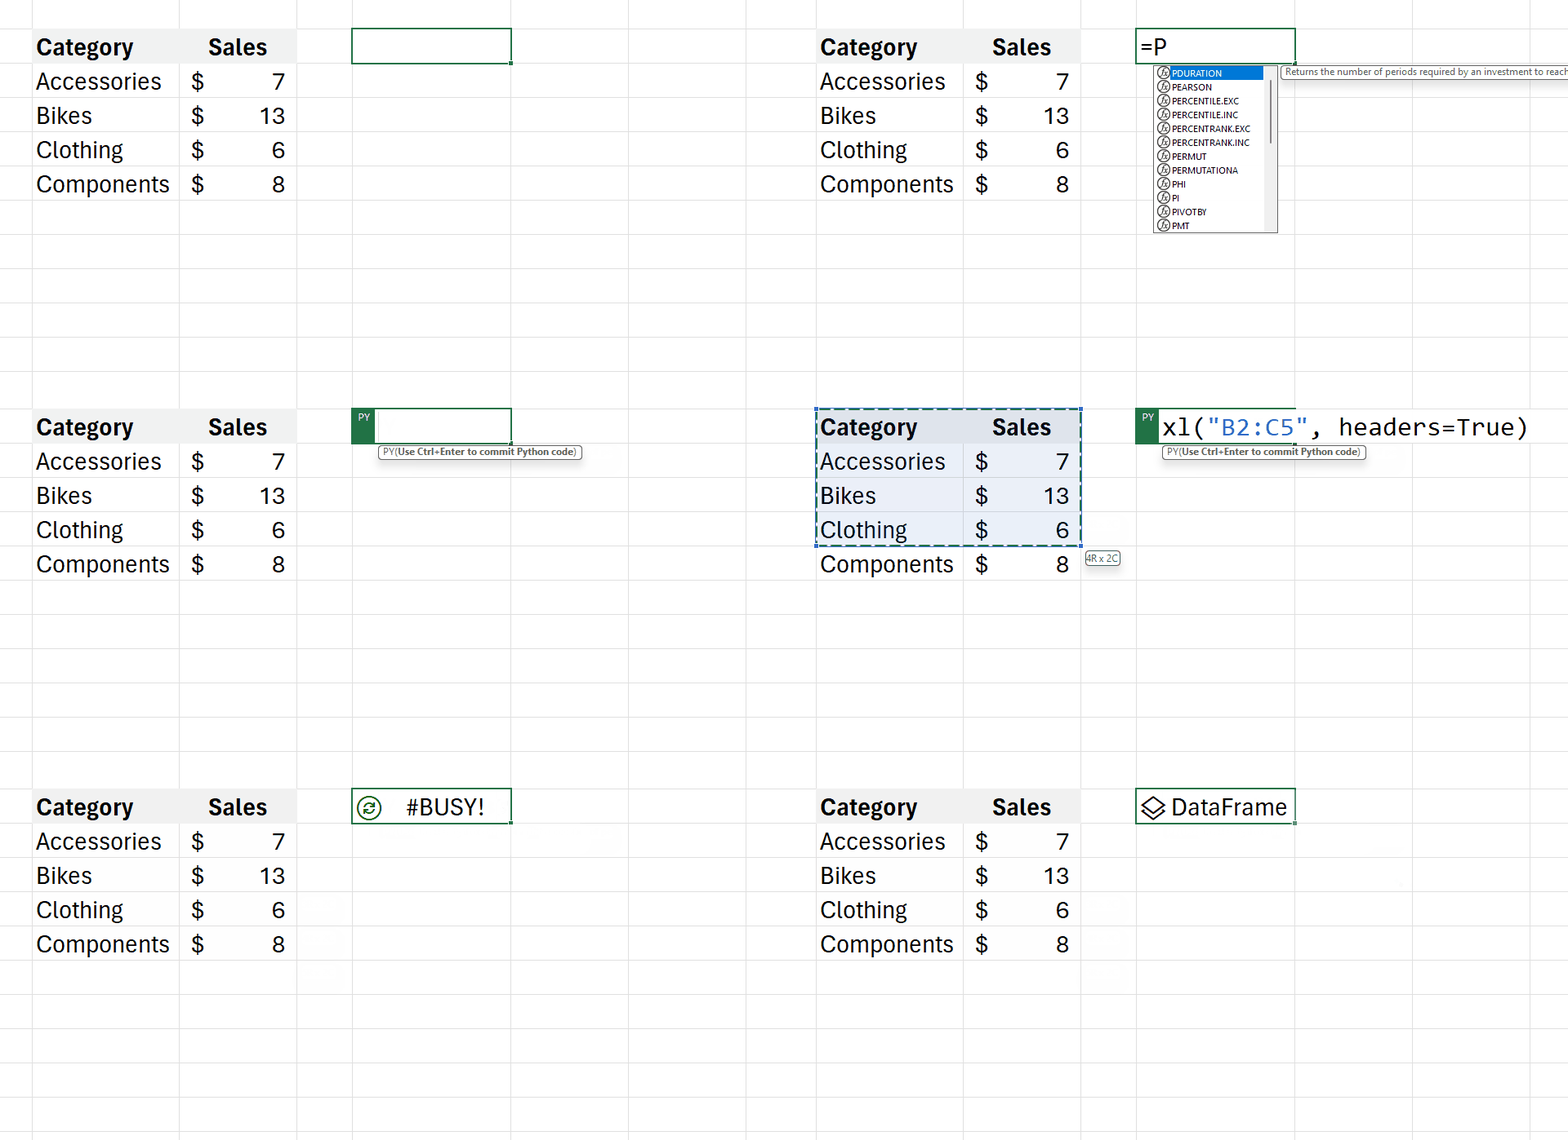
Here is an example of the =PY function in action:

It’s important to note that this new function operates securely within the Microsoft Cloud, ensuring enterprise-level security aligned with Microsoft 365's compliance standards.
A highlight of this function is its commitment to user privacy: it prohibits Python code from accessing user identity and adds an extra layer of security when opening workbooks from the internet by isolating them in unique containers.
Microsoft Excel reports:
“Data from your workbooks can only be sent via the built-in xl() Python function, and the output of the Python code can only be returned as the result of the =PY() Excel function.”

How to use the PY function
To use the new =PY function to access Python in Excel, simply type "=PY" in your desired Excel cell, followed by the relevant Python code.
Once the code is executed, the results - whether they’re calculations, data manipulations, or visualizations - materialize directly in the Excel worksheet.
For example, if you want to merge two intricate datasets, it can be accomplished quickly using Python code right within Excel, facilitated by this function.
Microsoft has reported that Python in Excel will be included with the Microsoft 365 subscription during the initial preview stage. However, they’ve also emphasized that some functionality will be restricted without a paid license after the preview comes to an end.

Using Python in Excel (finance applications)
The integration of Excel and Python has opened a whole new level of data analysis to transform your everyday workflow.
So, let’s take a closer look at the types of analysis you can achieve with Python in Excel:
Clean, prepare, and manipulate data
You can use Python in Excel to clean and manipulate your data. This is because Python's integration into Excel introduces a robust suite of data cleaning tools, streamlining the often complex and time-consuming process of data preparation. You can now effortlessly pinpoint missing values, standardize inconsistent formats, and eradicate duplicate entries.
Beyond these basics, the flexibility of Python allows for more advanced manipulations like employing regular expressions, which proves invaluable for pattern-based transformations and refinements.
Build advanced data visualizations
Both Anaconda and Microsoft say that with Python in Excel, users can create advanced data visualizations. In Excel, users can harness the capabilities of Python charting libraries such as Matplotlib and Seaborn, to craft diverse and intricate visualizations.
From traditional bar graphs and line charts to more specialized displays like heatmaps, violin plots, and swarm plots, these libraries enhance Excel's data representation, offering a richer perspective on datasets.
Financial forecasting (plus predictive analytics & machine learning)
The integration of Python libraries like scikit-learn and statsmodels into Excel opens the door to a wealth of advanced analytical techniques.
You can employ machine learning for predictive analytics, use regression analysis to better understand asset price movements or delve into time series modeling for accurate financial forecasting.
Share and collaborate with your team
Sharing Python-driven analyses is now as simple as sharing any Excel workbook. Colleagues can interact with and update the Python-based analytics without the hassle of extra installations or managing intricate dependencies.
Team members can engage through comments, @ mentions, and co-author just as they would with standard Excel files. Even if a teammate doesn't have the Python in Excel feature activated, they can still refresh the analytics to view the latest information.
Plus, with the application of sensitivity labels, all shared Excel workbooks align with an organization's information protection protocols. Essentially, it retains the power of Python analytics while facilitating effortless collaboration in an Excel-friendly manner.

FAQs: Python in Excel
How do I connect Excel to Python?
Simply type =PY() in an Excel cell and follow it with your Python code. Python in Excel runs on the Microsoft Cloud, seamlessly integrating the two.
Can I use Python to automate Excel?
Yes, with the integration of Python in Excel, you can harness Python's capabilities to automate various Excel tasks and processes.
Can Python do everything Excel can do?
While Python is a versatile programming language with powerful data manipulation libraries, Excel offers unique features like PivotTables and user-friendly interfaces. The integration maximizes the strengths of both.
Can Python analyze Excel data?
Yes, with Python integrated into Excel, you can perform advanced analyses using Python libraries directly on your Excel data.
How do I use Python automation in Excel?
By integrating Python scripts using the =PY() function in Excel, you can automate data processing, analysis, and other tasks right within your workbook.
Join the Finance Alliance Community
Sign up to our free Finance Alliance Slack community and start networking with other CFOs and finance leaders. Share ideas, ask questions, discover new talent, and grow your network within one of the most engaged communities of finance professionals in the world.
So, what are you waiting for?
Sign up today!


